|
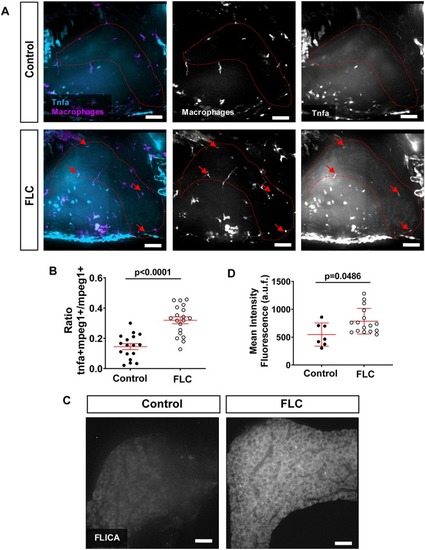
FLC larvae show increased pro-inflammatory macrophages and increased caspase-a activityinthe liver area. (A) Representative MIPs of 7 dpf FLC larvae [Tg(fabp10a:dnajb1a-prkacaa_cryaa;Cerulean)/Tg(tnfa:egfp)/Tg(mpeg1:mCherry-caax)] and control siblings [Tg(tnfa:egfp)/Tg(mpeg1:mCherry-caax)]. Dotted red lines indicate liver area; red arrows indicate Tnfα-positive macrophages. (B) Graph showing ratio of Tnfα-positive macrophages to total macrophages in the liver area (control N=17, FLC N=19). (C) Representative MIPs of 7 dpf FLC larvae [Tg(fabp10a:dnajb1a-prkacaa_cryaa;Cerulean)] and control wild-type siblings. (D) Graph showing mean intensity fluorescent quantification in the liver area (control N=7, FLC N=16). Scale bars: 20 μm. Data are at least two independent experiments. Analysis performed in EMM in R. Dot plots show mean±s.e.m.; P-values are shown on graphs. a.u.f., arbitrary units of fluorescence.
|