|
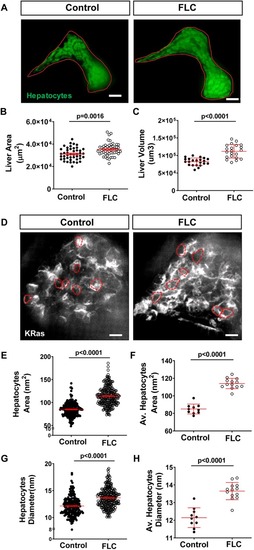
Overexpression ofzfDnaJa-Pkacamodulates liver morphology. (A) Representative MIPs of 7 dpf FLC larvae [Tg(fabp10a:dnajb1a-prkacaa)/Tg(fabp10a:egfp-l10a)] and control siblings [Tg(fabp10a:egfp-l10a)]. Dotted red lines indicate liver area. (B,C) Graphs showing liver area (B) (control N=45, FLC N=53) and liver volume (C) (control N=22, FLC N=21). (D) Representative MIPs of 7 dpf FLC larvae [Tg(fabp10a:dnajb1a-prkacaa)/Tg(fabp10a:mCherry-kras)] and control siblings [Tg(fabp10a:mCherry-kras)]. Dashed red lines indicate hepatocyte area. (E-H) Graphs showing hepatocyte area (E,F) and diameter (G,H). In E and G, each dot represents one hepatocyte (control N=201, FLC N=261); in F and H, each dot represents one larva (control N=10, FLC N=13). Scale bars: 20 μm. Data are from at least three independent experiments. Analysis performed in EMM in R. Dot plots show mean±s.e.m.; P-values are shown on graphs.
|