|
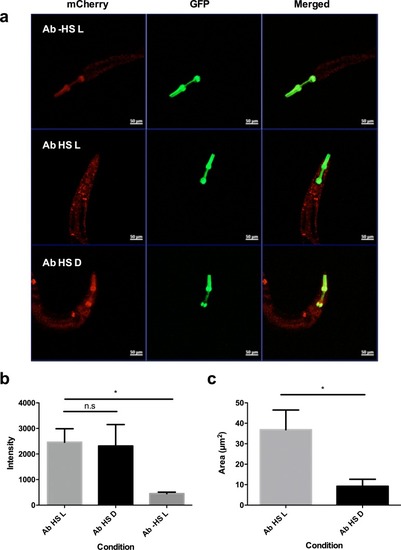
Exposure to light drives Aβ aggregation in <italic>C. elegans</italic> strains 24 hr post heat- shock.(a) Confocal microscopy images of mutant C. elegans 24 hr post heat-shock at 20x magnification in Aβ -HS L (no heat shock, exposed to light), Aβ HS L (with heat shock, exposed to light) and Aβ HS D (with heat shock, kept in the dark) conditions. Aβ -HS L worms are used as a control for quantifying baseline Aβ expression. Distinct puncta (yellow) can be seen in animals in Aβ HS L condition. No red fluorescence was observed in control animals without the transgene (not shown). (b) Quantification of intensity of red fluorescence measured in the animals in Aβ HS L (n = 13), Aβ HS D (n = 9) and Aβ -HS L (n = 5) conditions 24 hr post heat-shock. Difference in expression between Aβ HS L conditions and Aβ -HS L is statistically significant (p=0.034). (C) Quantification of total area of bright puncta in the animals in Aβ HS L (n = 13), and Aβ HS D (n = 9) conditions 24 hr post heat-shock. Difference in area of fluorescence between Aβ HS L conditions and Aβ HS D is statistically significant (p=0.031).
|