<styled-content toggle='no' style='fixed-case'>FST</styled-content> was increased in <styled-content toggle='no' style='fixed-case'>FLT</styled-content>3/<styled-content toggle='no' style='fixed-case'>ITD</styled-content>‐transgenic zebrafish and <styled-content toggle='no' style='fixed-case'>FLT</styled-content>3/<styled-content toggle='no' style='fixed-case'>ITD</styled-content>‐mutated <styled-content toggle='no' style='fixed-case'>AML</styled-content>
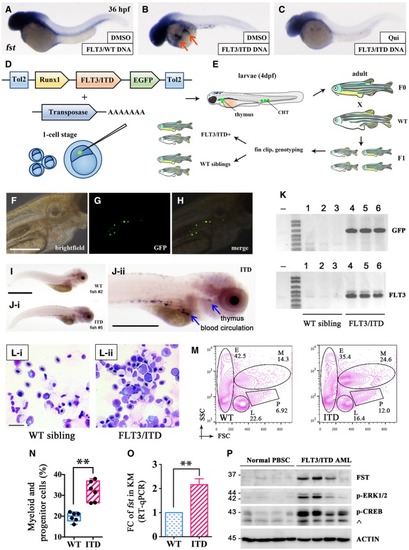
WISH of fst in FLT3/WT (A), and FLT3/ITD plasmid DNA‐injected zebrafish embryos without (B) or with (C) quizartinib treatment (2.5 μM) from 6 to 36 hpf. fst expression was expanded by FLT3/ITD DNA in 86% of embryos (B, arrow, 32/37) which could be effectively blocked by treating with FLT3 inhibitor quizartinib in 83% of embryos (C, 29/35).
Generation and characterization of FLT3/ITD‐transgenic zebrafish. Diagrammatic representation (D and E) of the generation of Runx1‐FLT3/ITD‐transgenic zebrafish (see Materials and Methods section). GFP expression was detected by fluorescent microscopy (F–H) and in blood circulation and thymus by WISH (I and J, blue arrow) in WT sibling and Runx1‐FLT3/ITD‐transgenic zebrafish (F1) embryos at 4 dpf. FLT3/ITD‐positive zebrafish (F1) were confirmed by PCR genotyping of GFP and FLT3/ITD using genomic DNA from fin clip of WT siblings and Runx1‐FLT3/ITD‐transgenic zebrafish (F1) at 2 months old. Fish 4, 5, and 6 showed germline transmission of FLT3/ITD transgene (K).
Kidney marrow (KM) was collected from Runx1‐FLT3/ITD‐transgenic zebrafish (F1) at 18 months old. The morphology and hematopoietic composition of KM from WT siblings (n = 6) and Runx1‐FLT3/ITD‐transgenic (n = 6) zebrafish were examined by Giemsa staining (L) and flow cytometry (M, N) (abbreviation for panel M: M, myeloid cells; P, progenitor cells; L, lymphoid cells; E, erythroid cells). Data are presented in box plot. The whiskers, boxes, and central lines in panel N represented the minimum‐to‐maximum values, 25th‐to‐75th percentile, and the 50th percentile (median), respectively. **P < 0.01 (Student's t‐test).
Expression of fst was detected by RT–qPCR in KM from WT sibling and Runx1‐FLT3/ITD‐transgenic zebrafish at 18 months old. The RT–qPCR experiments were performed in triplicates, and data were presented as mean ± SEM. **P < 0.01.
Detection of FST expression, p‐ERK1/2, and p‐CREB in mononuclear cells from normal peripheral blood stem cell (PBSC) and FLT3/ITD AML patients (diagnostic samples with leukemia blasts > 80%) by Western blotting. ^: non‐specific staining of p‐ATF1 protein due to the conserved motif.
Data information: Scale bar = 500 μm.Source data are available online for this figure.
This image is the copyrighted work of the attributed author or publisher, and
ZFIN has permission only to display this image to its users.
Additional permissions should be obtained from the applicable author or publisher of the image.
Full text @ EMBO Mol. Med.
Your Input Welcome
Thank you for submitting comments. Your input has been emailed to ZFIN curators who may contact you if
additional information is required.
Oops. Something went wrong. Please try again later.