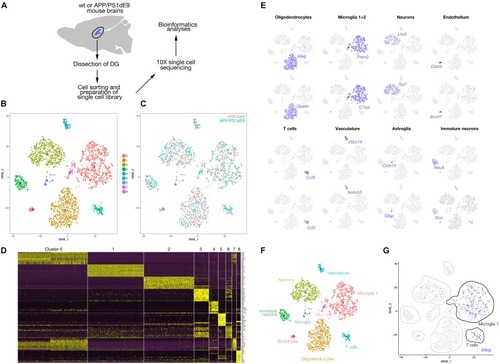
(A) Schematic overview of the single cell sequencing procedure. Dissected dentate gyri (DG) of hippocampi were dissociated into single cells, sorted by flow cytometry. Cells were subjected to 10X library preparation, followed by 3′ end transcriptome sequencing and bioinformatics analyses. (B) tSNE plot after cell clustering. (C) Cells from wild type and APP/PS1dE9 mouse DG plotted in different colors on the tSNE supporting a similar cell type composition and distribution. (D) Heat map for cell clusters showing top10 marker genes. (E) Feature plots for several genes known to be markers of various cell types. Cell clusters are named according to the marker gene expression: Mag and Opalin for oligodendrocytes, C1qa and Trem2 for microglia, Lhx5 and Syt1 for neurons, Cldn5 and Acvrl1 for endothelial cells, Ccl5 and Cd2 for T cells, P2ry14 and Notch3 for vasculature, Cldn10 and Gfap for astroglia, Neu4 and Dcx for immature neurons. (F) Named cell clusters on tSNE plot. (G) Expression of Il4r on tSNE plot. IL4 receptor is expressed mainly in microglia and T cells. Very few neurons also express the receptor. Il4r is not expressed in astroglia.
|
