FIGURE

Figure 5

ID
ZDB-FIG-200406-278
Publication
Mateus et al., 2020 - BMP Signaling Gradient Scaling in the Zebrafish Pectoral Fin
Other Figures
All Figure Page
Back to All Figure Page
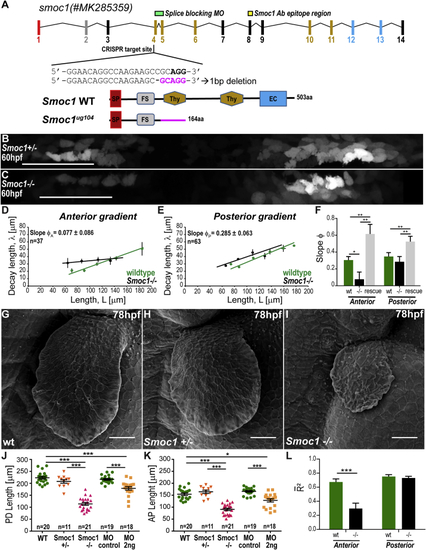
Figure 5

Smoc1 Mutants Scaling Phenotype

(A) smoc1 genomic structure. Exon colors match the protein domains they encode: SP, signal peptide; FS, follistatin-like domain; Thy, thyroglobulin-like domain; EC, extracellular domain. Target sequence of the Smoc1ug104 CRISPR mutant is located in exon 4; mutant sequence of Smoc1ug104, highlighted in magenta. Smoc1ug104 results in a truncated protein, which lacks the first Thyroglobulin domain and other downstream features. The position of the splicing morpholino and Smoc1 antibody epitope region are indicated.

(B and C) BRE:GFP gradients in Smoc1 homozygote mutants (C) and heterozygote controls (B) displayed as straightened ROI, as in Figure 1D (anterior, left).

(D and E) Decay length versus ROI half-length (L) of BRE:GFP gradients in Smoc1−/− mutants (black) and wild-type controls (green, from Figures 3C and 3D). Dots, average from length bins ± SEM (for individual data points, see Figures S4W–S4X). Lines, linear fits to individual data. Slope (φ) values ± SEM are shown.

(F) Comparison of φ=λ/L from BRE:GFP gradients of wild-type, Smoc1−/− mutants and Smoc1−/− mutants injected with smoc1 mRNA (“rescue”).

(G–I) Scanning electron micrographs of wild-type (G), Smoc1 heterozygote control (H), and Smoc1 homozygote fins (I).

(J and K) Average PD (J) and AP (K) fin lengths at 78 hpf in different mutant and morphant (MO) conditions.

(L) Comparison of average goodness of fit, R2(R2) obtained from collapse analysis (see Figures S4A–S4H) of BRE:GFP gradients in wild-type or Smoc1−/− mutants. n represents number of fins analyzed.

For all statistical analyses: ∗∗∗p < 0.0001; ∗∗p < 0.01, p < 0.05; two-tailed, unpaired, non-parametric Mann-Whitney tests. Mean ± SEM are shown in all graphs. Anterior, left; distal down. Scale bars, 50 μm. BRE:GFP transgene used: BRE:eGFP (Laux et al., 2011) (B–F, L). See also Figures S4 and S5.

Expression Data

Expression Detail
Antibody Labeling
Phenotype Data
Fish:
Observed In:
Stage Range: Pec-fin to Protruding-mouth

Phenotype Detail
Acknowledgments
This image is the copyrighted work of the attributed author or publisher, and ZFIN has permission only to display this image to its users. Additional permissions should be obtained from the applicable author or publisher of the image. Full text @ Cell Rep.