
FIGURE
Fig. 5
- ID
- ZDB-FIG-200406-151
- Publication
- Ni et al., 2020 - Isoniazid causes heart looping disorder in zebrafish embryos by the induction of oxidative stress
- Other Figures
- All Figure Page
- Back to All Figure Page
Fig. 5
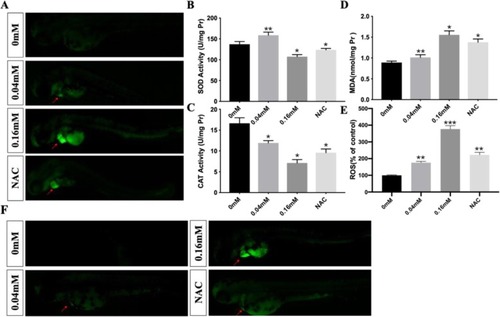
The ROS level in control, 0.04 mM, 0.16 mM and NAC groups ( |
Expression Data
Expression Detail
Antibody Labeling
Phenotype Data
| Fish: | |
|---|---|
| Condition: | |
| Observed In: | |
| Stage: | Long-pec |
Phenotype Detail
Acknowledgments
This image is the copyrighted work of the attributed author or publisher, and
ZFIN has permission only to display this image to its users.
Additional permissions should be obtained from the applicable author or publisher of the image.
Full text @ BMC Pharmacol Toxicol