IMAGE

Fig. 5

ID
ZDB-IMAGE-200406-153
Source
Figures for Ni et al., 2020
Image
Figure Caption

Fig. 5

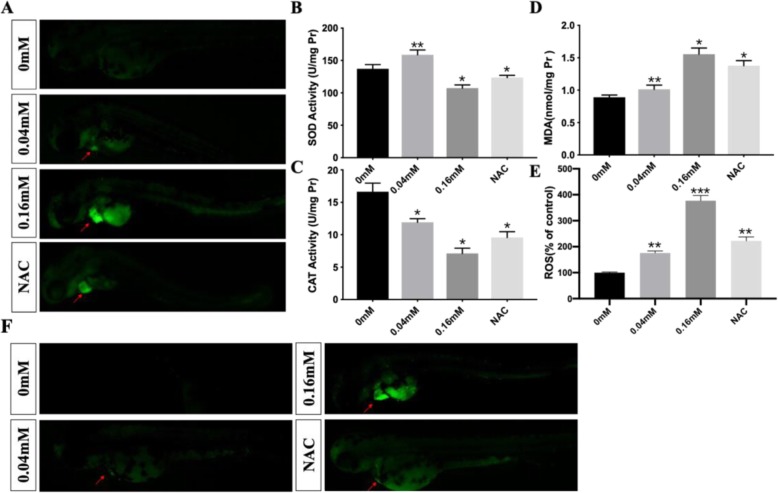
The ROS level in control, 0.04 mM, 0.16 mM and NAC groups (a). The activity of CAT (b) and SOD (c) induced by isoniazid. The concentration of MDA (d), ROS (e) and apoptosis level (f) in different treated groups. The unit of SOD and CAT were ul/mg protein while MDA nmol/mg protein. The concentration of ROS was normalized to 0 mM groups. The red arrows represented the pericardial areas. *P < 0.05, **P < 0.1, ***P < 0.001, ns means no significance

Figure Data
Acknowledgments
This image is the copyrighted work of the attributed author or publisher, and ZFIN has permission only to display this image to its users. Additional permissions should be obtained from the applicable author or publisher of the image. Full text @ BMC Pharmacol Toxicol