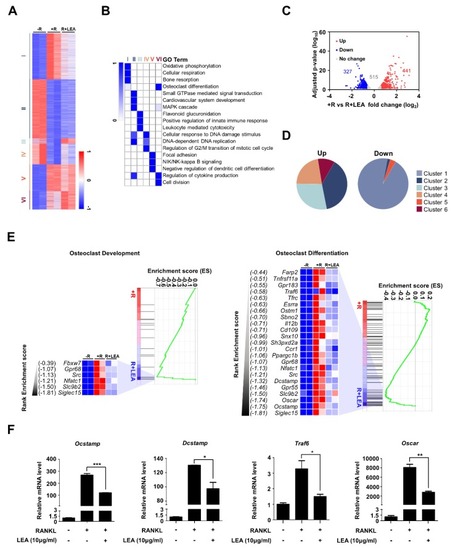
LEA alters gene expression profiling in BMMs. (A) K-means (K = 6) clustering of 4740 differentially expressed genes (DEGs) in any pairwise comparison among three conditions (−R; no RANKL, +R; RANKL, R + LEA; ethyl acetate fraction of L. edodes with RANKL). Clusters are indicated on the left. (B) Heatmap showing the p-value significance of GO term enrichment for genes in each cluster. (C) Volcano plot of transcriptomic changes between +R and R + LEA. Genes with increased (red) or decreased (blue) expression in LEA + RANKL-treated cells relative to RANKL-treated cells were defined based on FDR-adjusted p < 0.05 and greater than 1.5-fold expression changes. (D) Pie charts showing each cluster portion of as in (C). Up: Cluster 1 (0%), Cluster 2 (38.5%), Cluster 3 (28.3%), Cluster 4 (22.2%), Cluster 5(0%), and Cluster 6 (11%). Down: Cluster 1 (94.5%), Cluster 2 (1.8%), Cluster 3 (0%), Cluster 4 (0%), Cluster 5 (3.7%), and Cluster 6 (0%). (E) GSEA of 4740 genes as in (A) shows the enrichment of genes associated with osteoclast development and osteoclast differentiation. Heatmap represents core enriched genes based on their enrichment score. (F) qRT-PCR was performed to quantify relative mRNA levels of the representative genes for osteoclastogenesis. Error bars represent the mean result ± SD of three independent experiments; * p < 0.05, ** p < 0.01, *** p < 0.001.
|
