
Fig. 7
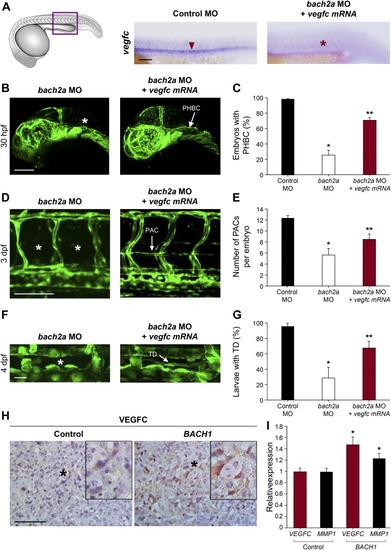
BACH mediates angiogenesis and lymphangiogenesis in a VEGFC-dependent manner. (A) Whole-mount in situ hybridization of 24-hpf, wild-type zebrafish embryos demonstrating the expression of vegfc mRNA after injection with control MO (Control MO 10 ng, red arrowhead) and the absence of its expression in embryos injected with specific MO targeting bach2a (3.75 ng, bach2a MO, red asterisk). Scale bar, 100 μm. (B) Confocal images of 30-hpf Tg(fli1:EGFP)y1 embryos co-injected with specific MOs targeting bach2a (3.75 ng) and in vitro–transcribed vegfc mRNA (800 pg, bach2a MO + vegfcmRNA) demonstrating the restoration of PHBC (white arrow). (C)Percentage of rescued PHBC defects in 30-hpf Tg(fli1:EGFP)y1 embryos after co-injection with bach2a MO (3.75 ng) and vegfc mRNA (800 pg, nControl MO = 56; nbach2a MO = 58; nbach2a MO + vegfc mRNA = 56). Error bars, mean ± SEM; * or **P < 0.0001. (D) Rescue of parachordal cell (PAC) development in 3-dpf Tg(fli1:EGFP)y1 embryos after the co-injection of bach2a MO and vegfcmRNA (bach2a MO + vegfc mRNA; PACs are indicated by a white arrow). Scale bar, 100 μm. (E) Quantification of the number of PAC-containing segments (mean ± SEM) in 3-dpf Tg(fli1:EGFP)y1 embryos after the co-injection of bach2a MO (3.75 ng) and vegfc mRNA (nControl MO = 47; nbach2a MO= 27; nbach2a MO + vegfc mRNA = 54; * or **P < 0.01). (F) Thoracic duct (TD) formation in 4-dpf Tg(fli1:EGFP)y1 embryos co-injected with bach2a MO and vegfc mRNA (bach2a MO + vegfc mRNA; TD is indicated by a white arrow). Scale bar, 20 μm. (G) Percentage of 4-dpf Tg(fli1:EGFP)y1 embryos showing normal TD after bach2a MO and vegfc mRNA injection (bach2a MO + vegfcmRNA). (nControl MO-10ng = 32; nbach2a MO = 65; nbach2a MO + vegfc mRNA = 68 (Error bars, mean ± SEM; * or **P < 0.01. (H) Immunohistochemistry labeling of control (Control) or BACH1 (BACH1) ectopically expressing ES2 ovarian carcinoma xenograft specimens using anti-VEGFC antibodies and counterstaining with hematoxylin (blue). Black asterisk localizes the region magnified in the black frame. Scale bar, 100 μm. (I) Quantitative RT-PCR measurement of VEGFC and MMP1 mRNA expression in xenograft initiated either from control or BACH1-overexpressing ES2 cells (n = 5 in each group; mean ± SEM; *P < 0.05. (C, E, G, I) Kruskal–Wallis test in panels (C, E, G) and Wilcoxon rank sum test in panel (I). |
| Genes: | |
|---|---|
| Fish: | |
| Knockdown Reagent: | |
| Anatomical Terms: | |
| Stage Range: | Prim-5 to Day 4 |
| Fish: | |
|---|---|
| Knockdown Reagent: | |
| Observed In: | |
| Stage Range: | Prim-5 to Day 4 |