
Fig. S3.
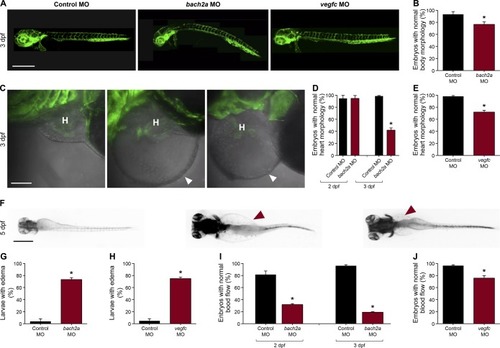
Knockdown of bach2a causes morphological defects in zebrafish embryos. (A) Lateral-view confocal micrographs of full-body, 3-dpf Tg(fli1:EGFP)y1zebrafish embryos after injection with control (10 ng, Control MO), bach2a(3.75 ng, bach2a MO), or vegfc (10 ng, vegfc MO) morpholino oligonucleotide, showing body curvature of bach2a morphants. Scale bar, 500 μm. (B) Percentage of 3-dpf Tg(fli1:EGFP)y1 zebrafish embryos with a normal morphology (no body curvature) after injection with control (10 ng, Control MO) or bach2a MO (3.75 ng, nControl MO = 46; nbach2a MO = 47 *P ≤ 0.0005). (C) Confocal images of the heart morphology of 3-dpf Tg(fli1:EGFP)y1 zebrafish embryos after injection with control, bach2a, or vegfc MO. H marks the heart and a white arrowhead, a pericardial edema. Scale bar, 500 μm. (D) Quantification of 2- and 3-dpf Tg(fli1:EGFP)y1zebrafish embryos with a normal heart morphology after injection with control MO (10 ng, Control MO) or bach2a MO (3.75 ng, 2 dpf: nControl MO = 16; nbach2a MO = 19; 3 dpf: nControl MO = 47; nbach2a MO = 58; *P < 0.0001). (E)Percentage of 3-dpf Tg(fli1:EGFP)y1 zebrafish embryos with a normal heart morphology after injection with control MO (10 ng) or vegfc MO (10 ng, nControl MO = 54; nvegfc MO = 41; *P < 0.0001). (F) Dorsal view of 5-dpf Tg(fli1:EGFP)y1 zebrafish larvae after injection with control MO, bach2a MO, or vegfc MO. Red arrowhead indicates edema. Scale bar, 100 μm. (G)Percentage of 5-dpf Tg(fli1:EGFP)y1 zebrafish larvae with edema after injection with control MO (10 ng) or bach2a MO (3.75 ng, nControl MO-10ng = 22; nbach2a MO = 28; *P < 0.05). (H) Quantification of 5-dpf Tg(fli1:EGFP)y1zebrafish larvae with edema after injection with control MO (10 ng) or vegfc MO (10 ng, nControl MO = 22; nvegfc MO = 53; *P < 0.0001). (I) Percentage of 2- and 3-dpf Tg(fli1:EGFP)y1 zebrafish embryos with a normal blood flow rate after injection with control MO (10 ng) or bach2a MO (3.75, 2 dpf: nControl MO = 14; nbach2a MO = 19; 3 dpf: nControl MO = 47; nbach2a MO = 58; *P < 0.05). (J) Percentage of 3-dpf Tg(fli1:EGFP)y1 zebrafish embryos with a normal blood flow rate after injection with control MO (10 ng) or vegfc MO (10 ng: nControl MO = 54; nvegfc MO = 41; *P < 0.004). (B, D, E, G, H, I, J) Wilcoxon rank sum test in panels (B, D, E, G, H, I, J). |