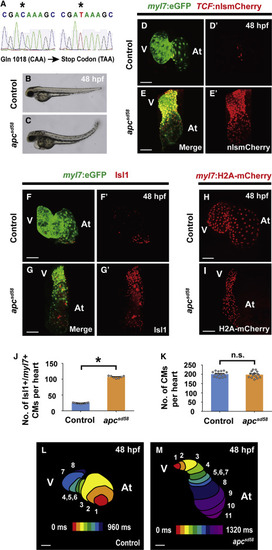
apc Loss-Of-Function Mutant (apcsd58) Displays Constitutively Activated Canonical Wnt Signaling and Ectopic Pacemaker Formation (A) Sequence analysis of sd58 mutants reveals a C to T nonsense mutation at amino acid 1,018 in the apc gene, thus resulting in a putative premature truncation. (B and C) Bright-field microscopy of the lateral view of (B) wild-type (n = 12 embryos) and (C) apcsd58 mutant (n = 10 embryos) embryos shows that apcsd58 mutants display an upward curved tail and edema at 48 hpf. Confocal images of (D, D’, F, F’, and H) wild-type and (E, E’, G, G’, and I) apcsd58 mutant embryos at 48 hpf reveal that apcsd58 mutant hearts display (E and E’) increased canonical Wnt-activation as detected by TCF:nlsmCherry (n = 8 embryos) and (G and G’) increased number of Isl1+/myl7+ pacemaker cardiomyocytes (n = 7 embryos) but (I) no appreciable change in overall cardiomyocyte numbers (n = 14 embryos) when compared to (D, D’, F, F’, and H) respective wild-type control hearts (n = 7, 9, and 15 embryos). Images in (D’–G’) are single channels from (D–G) merged images, respectively. Green, (D–G) myl7:eGFP and red, (D–E′) TCF:nlsmCherry, (F–G′) anti-Isl1 immunostaining, and (H and I) myl7:H2A-mCherry. (J and K) Bar graphs show the average number of (J) Isl1+/myl7+ pacemaker cardiomyocytes (CMs) from (F–G’) or (K) total cardiomyocytes from (H and I). (L and M) Optical-mapping of the propagation of calcium activation in (L) control (n = 9 embryos) and (M) apcsd58 mutant (n = 7 embryos) hearts at 48 hpf reveals retrograde cardiac conduction from ventricle to atrium in apcsd58 mutants. Numbers at each isochronal line (60-ms intervals) indicate temporal sequence of calcium activation in the heart. At, atrium and V, ventricle. Scale bar, 50 μm. Mean ± SEM. ∗p < 0.05 by Student’s t test. n.s., not significant. See also Figure S3.
|
