|
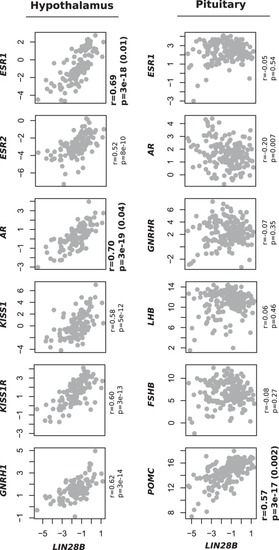
LIN28B correlations with hormonal genes in the hypothalamus and pituitary in GTEx. The figures show relative LIN28B expression on the X-axis compared to the expression of selected genes from the hypothalamus in the Y-axis (log2 TPM + 1). LIN28B expression correlated positively with all the tested genes in the hypothalamus (R = 0.58–0.70, P < 8e-10))). Particularly, the expression of ESR1 and AR was upregulated: these genes showed statistically more robust correlations with LIN28B than the majority of the other ~50000 transcripts (p-value in parenthesis). Although GNRHR, LHB and FSHB showed no correlations with LIN28B levels in the pituitary, we observed a statistically significant positive correlation between LIN28B and POMC expression (R = 0.57, P = 3e-17). The correlation with POMC was among the most robust correlations for LIN28B in the pituitary.
|