FIGURE

Figure 3

ID
ZDB-FIG-200310-44
Publication
Leinonen et al., 2019 - LIN28B affects gene expression at the hypothalamic-pituitary axis and serum testosterone levels
Other Figures
All Figure Page
Back to All Figure Page
Figure 3

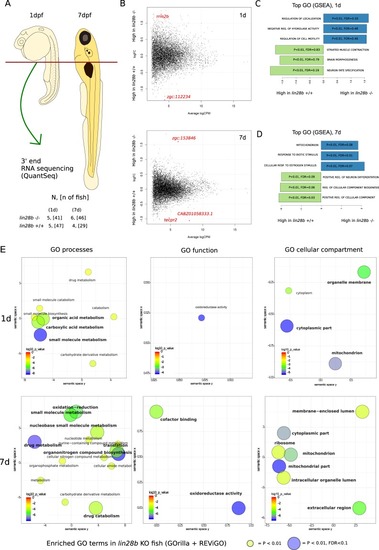
Summary of the RNA-Seq experiment examining the global RNA expression in the lin28b mutant fish at 1d and 7d. (A) Sampling and study design. After dissecting the anterior part from embryos/larvae, we pooled 6–10 samples together. The resulting 4–6 biological replicates per group were subjected to RNA sequencing. (B) Plots of mean logFC differences between the lin28b −/− and the +/+ fish at 1dpf (upper panel), and at 7dpf (lower panel). The genes showing significantly different expression in the global analysis (p < 0.00005, FDR < 0.1) are highlighted in red. (C,D) Results from the gene ontology analysis by GSEA, showing the GO categories differentiating between the lin28b −/− and the +/+ groups. E) Enriched GO terms in the lin28b −/− fish from the GOrilla analysis. Upper panels shows the results for the 1dpf fish and the lower panel for the 7dpf zebrafish.

Expression Data

Expression Detail
Antibody Labeling
Phenotype Data

Phenotype Detail
Acknowledgments
This image is the copyrighted work of the attributed author or publisher, and ZFIN has permission only to display this image to its users. Additional permissions should be obtained from the applicable author or publisher of the image. Full text @ Sci. Rep.