|
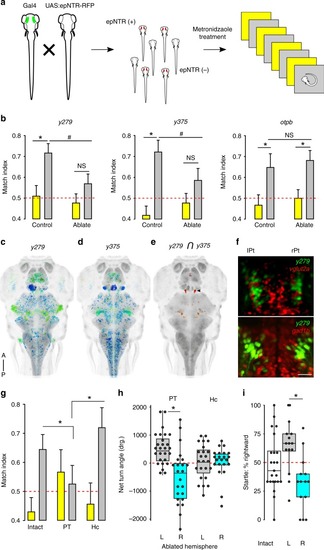
Neurons in the posterior tuberculum maintain left/right identity.a Chemogenetic ablation screen: transgenic lines with restricted Gal4 patterns were crossed to a UAS:epNTR-RFP reporter. Both epNTR-RFP+ and non-fluorescent siblings (as controls) were treated with metronidazole before testing for motor asymmetry under light and dark conditions. b Match index for drug-treated controls (y279N = 53; y375N = 43; otpbAN = 35) and following genetic ablation (y279N = 57; y375N = 37; otpbAN = 46) during paired baseline (yellow) and dark (gray) responses. Asterisk p < 0.05, r = 0.31, 0.49, 0.3, and 0.34, respectively (left to right); #p < 0.05, r = 0.25, Mann–Whitney U test. c, d Whole-brain dorsal Zebrafish Brain Browser (ZBB) projections for y279 (c) and y375 (d). Color is depth scale. e Computed intersect y279 and y375 expression patterns. Arrowhead indicates a cluster in the rostral PT. f Dorsal confocal projection through the rostral PT in (top) y279-Gal4, UAS:Kaede (green) crossed to vglut2a:dsRed (red) or (bottom) y279-Gal4, UAS:Kaede (green) crossed to gad1b:dsRed (red). Scale bar 20 µm. g Match index in unablated controls (N = 45) and after bilateral laser ablation of the PT (N = 17) and Hc (N = 19) during baseline (yellow) and on dark trials (gray). Asterisk p < 0.05, r = 0.44 and 0.59, respectively, Mann–Whitney U test. h Net turn angle (mean on trials 1–4) for the left PT hemisphere (gray, N = 27) and the right PT hemisphere (cyan, N = 23) ablations. Hc unilateral ablations (right bars) (left hemisphere gray, N = 24; right hemisphere cyan, N = 22). Asterisk p < 0.001, d = 1.3, t test. i Percentage of dark evoked long-latency startle responses initiated in the rightward direction for intact controls (N = 23), left (N = 15) or right (N = 14) hemisphere PT ablation. Asterisk p < 0.001, d = 1.4, t test. Error bars represent standard error of the mean. Box plots show median and quartiles with whiskers indicating 10–90%. Source data are provided as a Source Data file.
|