
Figure 4
- ID
- ZDB-FIG-200306-98
- Publication
- Coolen et al., 2020 - Mosaic Heterochrony in Neural Progenitors Sustains Accelerated Brain Growth and Neurogenesis in the Juvenile Killifish N. furzeri
- Other Figures
- All Figure Page
- Back to All Figure Page
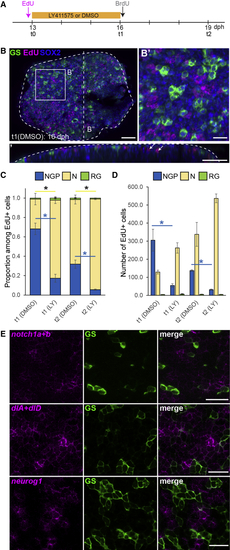
NGPs Behave Like Early Embryonic Progenitors (A) Experimental design. (B) Immunostaining for GS (green) and Sox2 (blue) combined with EdU detection (magenta) on a DMSO control 16 dph killifish pallium. Shown in (B’) is a high magnification of the dorsal view of the 3D reconstruction shown in (B). In (B’’) is 5 μm transverse section through the 3D reconstruction shown in (B). White arrows in (B’’) point to EdU+ cells in the parenchyme that we identified as neurons. Scale bars, 50 μm in (B) and (B’’) and 20 μm in (B’). (C) Proportion of EdU-labeled cells with NGP (blue, Sox2+GS−), neuronal (yellow, Sox2−GS−), or RG (green, Sox2+GS+) identity. ∗Corrected p value < 0.05. Data were analyzed for each cell type with a two-way ANOVA, followed by pairwise comparisons using Holm’s procedure. Proportions were arcsine transformed prior to analysis. Data are represented as mean ± SEM; n = 2 (t1) and n = 3 (t2) for each treatment condition for each treatment condition at t1 and t2, respectively. (D) Number of EdU-labeled cells per counted area with NGP (blue, Sox2+GS−), neuronal (yellow, Sox2− and GS−) or RG (green, Sox2+GS+) identity. ∗Corrected p value < 0.05. Data were analyzed for each cell type with a two-way ANOVA, followed by pairwise comparisons using Holm’s procedure. Data was rank transformed prior to analysis. Data are represented as mean ± SEM; n = 2 (t1) and n = 3(t2) for each treatment condition. (E) ISH for See also |