
- Title
-
Mosaic Heterochrony in Neural Progenitors Sustains Accelerated Brain Growth and Neurogenesis in the Juvenile Killifish N. furzeri
- Authors
- Coolen, M., Labusch, M., Mannioui, A., Bally-Cuif, L.
- Source
- Full text @ Curr. Biol.
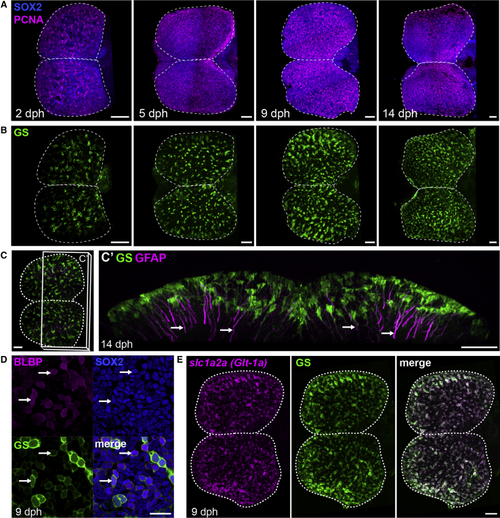
Apical Progenitors at the Pallial Surface of the Killifish Larval Pallium (A) Dorsal 3D views of killifish pallium (anterior left) at 2, 5, 9, and 14 days post-hatching (dph) with a whole-mount immunostaining for Sox2 (blue) and PCNA (magenta) highlighting neural progenitors. A dotted line contours the two pallial hemispheres. (B) Dorsal 3D views of the same brains as in (A), showing immunostaining signal for GS (green) to identify RGs. (C) Immunostaining for GS (green) and GFAP (magenta) at 14 dph indicating GFAP-enriched processes (arrows). Shown in (C) is a dorsal 3D view, and in (C’) is a frontal view of the 3D reconstruction with a transverse hemisection along the plane shown in (C). (D) Triple immunostaining for BLBP, Sox2, and GS at 9 dph. Images show high magnifications of the pallial surface on a single optical z-plane. Arrows point to RG cells (GS+BLBP+Sox2+). Scale bar, 20 μm. (E) ISH for See also |
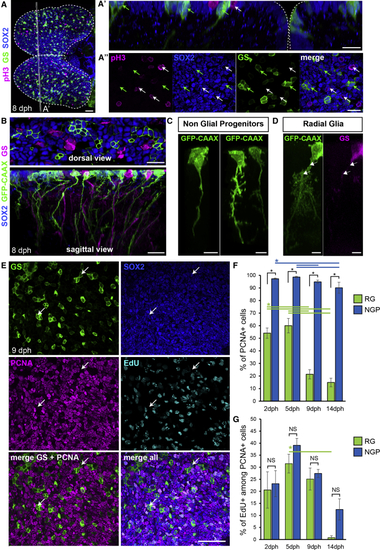
A Population of Apical Non-glial Progenitors Accounts for the Majority of Proliferating Progenitors in the Killifish Pallium (A) Immunostaining for GS (green), Sox2 (blue), and pH3 (magenta) at 8 dph. Shown is a dorsal 3D view. Shown in (A’) is high magnification of a 5 μm transverse section through the 3D reconstruction. Shown in (A″) is high magnification of a single optical z-plane. White arrows point to non-glial NGP progenitors entering mitosis at the apical surface and green arrows point to sparsely distributed RGs. (B) Shown at the top is the optical z-plane showing NGP electroporated with a GFP-CAAX-encoding plasmid (green), together with an immunostaining for GS (magenta) and Sox2 (blue). On the bottom is a sagittal view through a 3D reconstruction, highlighting the presence of a basal process on electroporated NGPs (green) and GS+ RGs (magenta). (C) Examples of NGP cell morphology. (D) Typical RG morphology, showing the ramified pattern of the basal process. Individual cells were manually detoured on a 3D reconstruction to visualize their morphologies. (E) Optical z-plane showing immunostaining for GS (green), Sox2 (blue) and PCNA (magenta), and EdU detection (cyan), on the high magnification of the pallial surface at 9 dph. White arrows point to non-cycling RG cells. (F) Proportion of PCNA+ cells among RGs (green bars) and NGPs (blue bars) at 2, 5, 9, and 14 dph. (G) Proportion of EdU+ cells among PCNA+ cells among RGs (green bars) and NGPs (blue bars). ∗Corrected p value < 0.05; two-way ANOVA, followed by pairwise comparisons using Holm’s procedure. Data were rank transformed prior to analysis. Data are represented as mean ± SEM; n = 6, 5, 5, and 3 for 2, 5, 9, and 14 dph, respectively. Scale bars, 50 μm in (A) and (E); 20 μm in (A’), (A’’), and (B); and 10 μm in (C) and (D). See also |
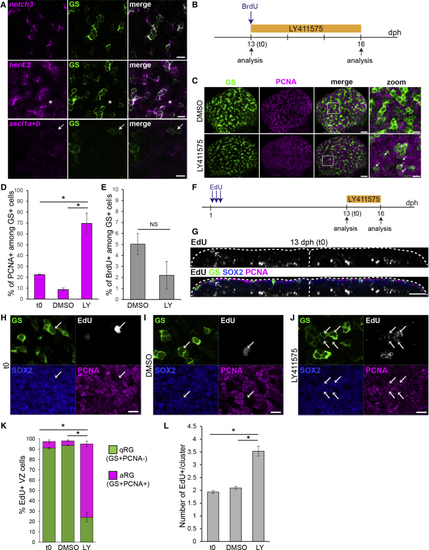
Killifish RG Enter in a Notch3-Dependent Quiescent State (A) ISH for (B) Experimental design for the data shown in (C)–(E). (C) Double immunostaining for GS (green) and PCNA (magenta) in DMSO control (top) and LY-treated (bottom) brains, illustrating the increase in PCNA+ RG cells (white arrows). Images on the right are high magnifications of the pallial surface. Scale bars, 30 μm (left) and 10 μm (right). (D) Proportion of PCNA+ cells among GS+ RGs before and after DMSO or LY treatment. (E) Proportion of BrdU-labeled cells among RG after DMSO or LY treatment (F) Experimental design for the data shown in (G)–(L). (G) Immunostaining for GS (green), Sox2 (blue) and PCNA (magenta), and EdU detection (gray) at the end of the chase (13 dph, t0). A 2 μm transverse section through a 3D reconstruction is shown. Arrows point to EdU+ RG cells at the ventricle. (H–J) Examples of EdU+ RG clusters observed at t0 (H), in control conditions (I), and after LY treatment (J). Optical z-planes showing immunostaining for GS (green), Sox2 (blue) and PCNA (magenta), and EdU detection (cyan) on the high magnification of the pallial surface are shown. Arrows point to EdU+ RG. Scale bar, 10 μm. (K) Proportion of EdU-labeled cells that are quiescent RGs (qRGs) (green, Sox2+GS+PCNA−) or activated RGs (aRGs) (purple, Sox2+GS+PCNA+). Only EdU+ cells located close to the ventricular zone (VZ) were considered for this analysis. (L) Average number of EdU+ cells inside each cluster of EdU+ cells. ∗Corrected p value < 0.05; one-way ANOVA, followed by pairwise comparisons using Holm’s procedure. Data were rank transformed prior to analysis. Data are represented as mean ± SEM; n = 3 for each treatment condition. See also |
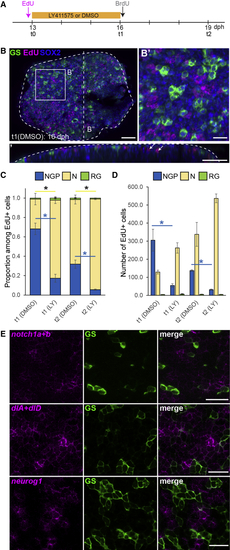
NGPs Behave Like Early Embryonic Progenitors (A) Experimental design. (B) Immunostaining for GS (green) and Sox2 (blue) combined with EdU detection (magenta) on a DMSO control 16 dph killifish pallium. Shown in (B’) is a high magnification of the dorsal view of the 3D reconstruction shown in (B). In (B’’) is 5 μm transverse section through the 3D reconstruction shown in (B). White arrows in (B’’) point to EdU+ cells in the parenchyme that we identified as neurons. Scale bars, 50 μm in (B) and (B’’) and 20 μm in (B’). (C) Proportion of EdU-labeled cells with NGP (blue, Sox2+GS−), neuronal (yellow, Sox2−GS−), or RG (green, Sox2+GS+) identity. ∗Corrected p value < 0.05. Data were analyzed for each cell type with a two-way ANOVA, followed by pairwise comparisons using Holm’s procedure. Proportions were arcsine transformed prior to analysis. Data are represented as mean ± SEM; n = 2 (t1) and n = 3 (t2) for each treatment condition for each treatment condition at t1 and t2, respectively. (D) Number of EdU-labeled cells per counted area with NGP (blue, Sox2+GS−), neuronal (yellow, Sox2− and GS−) or RG (green, Sox2+GS+) identity. ∗Corrected p value < 0.05. Data were analyzed for each cell type with a two-way ANOVA, followed by pairwise comparisons using Holm’s procedure. Data was rank transformed prior to analysis. Data are represented as mean ± SEM; n = 2 (t1) and n = 3(t2) for each treatment condition. (E) ISH for See also |