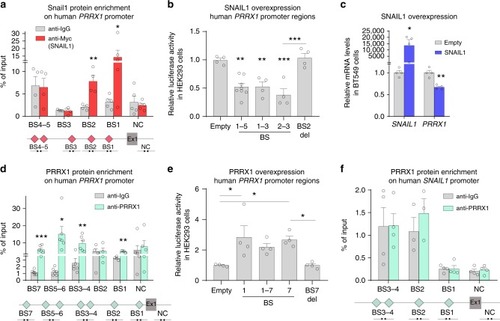
SNAIL1 and PRRX1 act antagonistically on PRRX1 promoter. a Snail1 enrichment in the human PRRX1 promoter shown by ChIP assay in BT549 cells, using anti Myc antibody (for Snail1-Myc overexpression). A schematic map is shown; red diamonds represent SNAIL1 potential binding sites (E-boxes; CANNTG) on PRRX1 promoter. (BS1: –1689, BS2: −4102, BS3: −6753, BS4: −7277, BS5: −7318 and NC: +104560). Ex1: PRRX1 exon 1 (n = 4). b Activity of different regions of the human PRRX1 promoter after SNAIL1 transfection assessed by luciferase assays in HEK293 cells (n = 4, except for BS1–5 for which n = 8). c qPCR assay showing downregulation of PRRX1 transcription upon SNAIL1 transfection in BT549 cells (n = 4). d PRRX1 directly binds to its own promoter, as assessed by ChIP assays in BT549 cells using a PRRX1 specific antibody. A schematic map is shown; cyan diamonds represent PRRX1 potential binding sites (TAATKDS) on its own promoter. (BS7: −6875, BS6: −5579, BS5: −5202, BS4: −4147, BS3: −4096, BS2: −1653, BS1: −1197 and NC: +104560). Ex1: PRRX1 exon 1 (n = 6, except for BS1–2 for which n = 4). e Activity of different regions of the human PRRX1 promoter after PRRX1 overexpression in luciferase assays in HEK293 cells (n = 4). f Lack of enrichment for PRRX1 binding to human SNAIL1 promoter assessed by ChIP assays in BT549 cells (BS4–1: −1753, −1621, −954, −198, and NC: +11799). Ex1: SNAIL1 exon 1 (n = 4). Locations of red and cyan diamonds represent distances between BSs and the promoter. Arrows represent primers used for qPCR amplification. BS biding site, NC negative control region, which does not contain potential BSs. Symbols in binding sites are as follows. K: T/G, D: G/A/T, S: G/C and N: G/A/T/C. Bars represent mean plus standard error of the mean (SEM), indicated (n) represent number of independent experiments as biological replicates and asterisks indicate significant p value in t test compared to the control in each test for (a), (e), (d), (f) and ANOVA with Bonferroni’s multiple comparison test for (b), (e) (*p < 0.05, **p < 0.01 and ***p < 0.001). Source data are provided as a Source Data file
|
