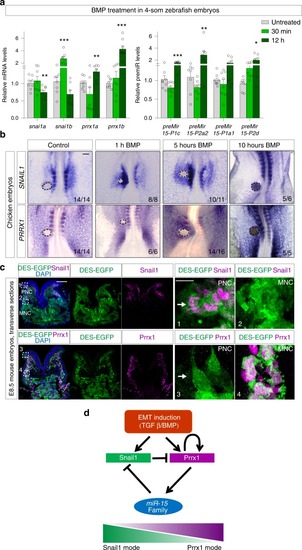
Snail1 and Prrx1 are sequentially expressed during EMT. a qPCR assay showing the expression of prrx1a/b and snail1a/b (left) and premiRNAs (right) in zebrafish embryos after different treatments with BMP (n = 8). Asterisks indicate significant p value in one-way ANOVA with Bonferroni’s multiple comparison test compared to the control. (*p < 0.05, **p < 0.01 and ***p < 0.001). Source data are provided as a Source Data file. b Dorsal view of HH9 chicken embryos showing SNAIL1 and PRRX1 expression in control embryos and at different times after BMP-soaked bead implantation. c Transverse sections of E8.5 DES-EGFP reporter mouse embryos showing IFs for GFP and Snail1 (upper panel) or Prrx1 (lower panel). Insets show higher magnification pictures for GFP and Snail1 (1 and 2), or for GFP and Prrx1 (3 and 4). d Schematic model of the gene regulatory network. DES downstream enhancer of Snail1, PNC premigratory neural crest shown by arrows, MNC migratory neural crest. Scale bars: 100 μm. Scale bars: 100 μm for sections and 10 μm for insets (boxes 3–4)
|
