
Figure 6
- ID
- ZDB-FIG-200228-50
- Publication
- Liu et al., 2020 - Analysis of zebrafish periderm enhancers facilitates identification of a regulatory variant near human KRT8/18
- Other Figures
-
- Figure 1
- Figure 1—figure supplement 1.
- Figure 1—figure supplement 2.
- Figure 1—figure supplement 3.
- Figure 1—figure supplement 4.
- Figure 1—figure supplement 5.
- Figure 1—figure supplement 6.
- Figure 1—figure supplement 7.
- Figure 2
- Figure 2—figure supplement 1.
- Figure 2—figure supplement 2.
- Figure 2—figure supplement 3.
- Figure 2—figure supplement 4.
- Figure 3—figure supplement 1.
- Figure 3.
- Figure 4
- Figure 4—figure supplement 1.
- Figure 4—figure supplement 2.
- Figure 4—figure supplement 3.
- Figure 5—figure supplement 1.
- Figure 5—figure supplement 2.
- Figure 5—figure supplement 3.
- Figure 5.
- Figure 6
- Figure 6—figure supplement 1.
- Figure 6—figure supplement 2.
- Figure 6—figure supplement 3.
- All Figure Page
- Back to All Figure Page
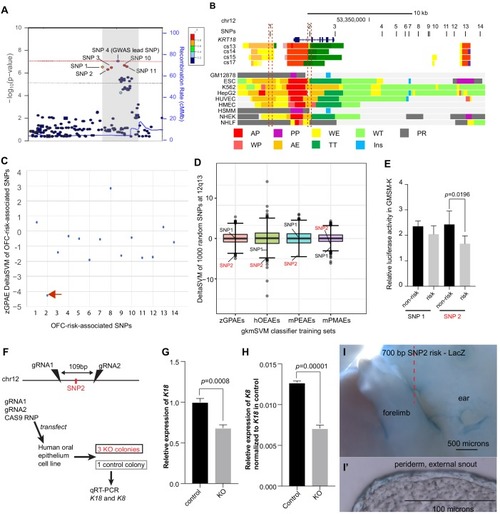
(A) Regional plot showing OFC-risk-associated single nucleotide polymorphism (SNPs) near KRT18 from this study. SNP4 is the lead SNP from our meta-analysis of OFC GWAS (Leslie et al., 2017). (B) Browser view of the human genome, hg19, focused on this locus. Tracks: SNPs: OFC-risk-associated SNPs. SNP1: rs11170342, SNP2: rs2070875, SNP3: rs3741442, SNP4: rs11170344, SNP5: rs7299694, SNP6: rs6580920, SNP7: rs4503623, SNP8: rs2363635, SNP9: rs2682339, SNP10: rs111680692, SNP11: rs2363632, SNP12: rs4919749, SNP13: rs2638522, SNP14: rs9634243. Color coded bars: Chromatin status (color code explained in key), revealed by ChIP-seq to various chromatin marks. Cs13-cs17, facial explants from human embryos at Carnegie stage (cs) 13–17, encompassing the time when palate shelves fuse (Wilderman et al., 2018). Roadmap Epigenomics Project cell lines (Visel et al., 2008): GM12878, B-cell derived cell line; ESC, Embryonic stem cells; K562, myelogenous leukemia; HepG2, liver cancer; HUVEC, Human umbilical vein endothelial cells; HMEC, human mammary epithelial cells; HSMM, human skeletal muscle myoblasts; NHEK, normal human epidermal keratinocytes; NHLF, normal human lung fibroblasts. AP, active promoter; WP, weak promoter; PP, poised promoter; AE, active enhancer; WE, weak enhancer; TT, transcriptional transition; WT, weakly transcribed; Ins, insulator; PR, polycomb-repressed. (C) deltaSVM scores predicted by zGPAEs-derived classifier for the 14 OFC associated SNPs near KRT18. (D) Box and whisker plots of deltaSVM scores of 1000 randomly-selected SNPs near KRT18, scored by classifiers trained by zGPAEs (zebrafish periderm active enhancers), hOEAEs (human oral epithelium active enhancers), mPEAEs (mouse palatal epithelium active enhancers) and mPMAEs (mouse palatal mesenchyme active enhancers). The line is the median scoring SNP, the box contains the middle-scoring two quartiles, and the whisker represent the top and lower quartiles. Dots are outliers. deltaSVM scores for SNP1 and SNP2 are indicated. Number out of 1000 randomly selected SNPs with a lower deltaSVM than SNP2 with classifier trained on zGPAEs, 2; on mPEAEs, 9; on hOEAEs, 17; on mPMAEs, 186. (E) Dual luciferase assay for non-risk and risk alleles of rs11170342 (SNP1) and rs2070875 (SNP2) in GMSM-K cells. (F) Schematic diagram showing the workflow of generating GMSM-K cell colonies with 109 bp flanking SNP2 deleted by CRISPR-Cas9. (G,H) qRT-PCR showing relative RNA expression of KRT18 (G) and KRT8 (H) in three homozygous knockout colonies (KO) and one isolated wild-type colony (Control) of GMSM-K cell lines. (I) Lateral view of transgenic mice LacZ reporter assay for the 700 bp DNA fragment overlapping SNP2. (I’) Section of the facial prominence from I (red circled region). |