
Figure 3.
- ID
- ZDB-FIG-200228-40
- Publication
- Liu et al., 2020 - Analysis of zebrafish periderm enhancers facilitates identification of a regulatory variant near human KRT8/18
- Other Figures
-
- Figure 1
- Figure 1—figure supplement 1.
- Figure 1—figure supplement 2.
- Figure 1—figure supplement 3.
- Figure 1—figure supplement 4.
- Figure 1—figure supplement 5.
- Figure 1—figure supplement 6.
- Figure 1—figure supplement 7.
- Figure 2
- Figure 2—figure supplement 1.
- Figure 2—figure supplement 2.
- Figure 2—figure supplement 3.
- Figure 2—figure supplement 4.
- Figure 3—figure supplement 1.
- Figure 3.
- Figure 4
- Figure 4—figure supplement 1.
- Figure 4—figure supplement 2.
- Figure 4—figure supplement 3.
- Figure 5—figure supplement 1.
- Figure 5—figure supplement 2.
- Figure 5—figure supplement 3.
- Figure 5.
- Figure 6
- Figure 6—figure supplement 1.
- Figure 6—figure supplement 2.
- Figure 6—figure supplement 3.
- All Figure Page
- Back to All Figure Page
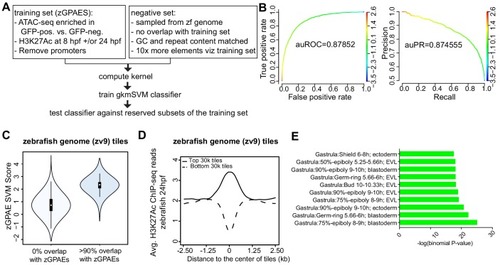
(A) Pipeline for training and cross-validation of gkmSVM classifier on zebrafish periderm enhancer candidates. (B) Receiver Operating Characteristic (ROC) and Precision-Recall (PR) curves using the gkmSVM trained on zGPAEs. au, area under. Color of curves corresponds to SVM scores. (C) Violin plots showing SVM scores of zebrafish genome tiles with 0% or at least 90% overlapped with the training set (GPAEs). (D) Average H3K27Ac ChIP-seq reads at the 30,000 elements with the highest or lowest scores from the gkmSVM trained on zGPAEs. (E) GO enrichment assay for genes associated with the top-scoring tiles 10,000 tilesincluding those that overlap the training set. |