
Figure 8
- ID
- ZDB-FIG-200215-39
- Publication
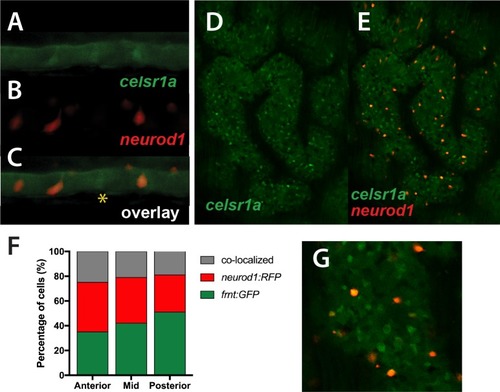
- Li et al., 2020 - Celsr1a is essential for tissue homeostasis and onset of aging phenotypes in the zebrafish
- Other Figures
- All Figure Page
- Back to All Figure Page
( |
| Genes: | |
|---|---|
| Fish: | |
| Anatomical Terms: | |
| Stage Range: | Day 4 to Adult |