
FIGURE
Figure 7.
- ID
- ZDB-FIG-200210-22
- Publication
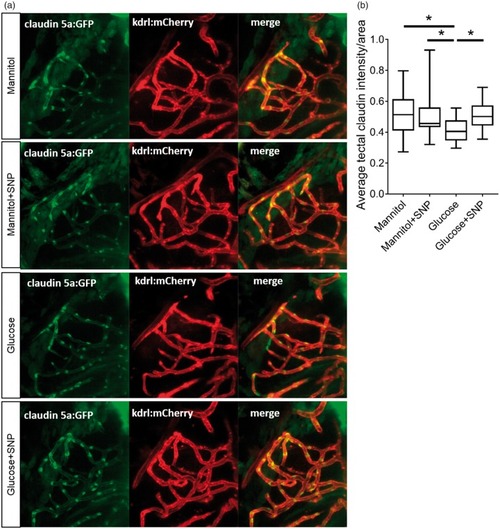
- Chhabria et al., 2018 - The effect of hyperglycemia on neurovascular coupling and cerebrovascular patterning in zebrafish
- Other Figures
- All Figure Page
- Back to All Figure Page
Figure 7.
|
Expression Data
| Gene: | |
|---|---|
| Fish: | |
| Conditions: | |
| Anatomical Term: | |
| Stage: | Days 7-13 |
Expression Detail
Antibody Labeling
Phenotype Data
| Fish: | |
|---|---|
| Conditions: | |
| Observed In: | |
| Stage: | Days 7-13 |
Phenotype Detail
Acknowledgments
This image is the copyrighted work of the attributed author or publisher, and
ZFIN has permission only to display this image to its users.
Additional permissions should be obtained from the applicable author or publisher of the image.
Full text @ J. Cereb. Blood Flow Metab.