|
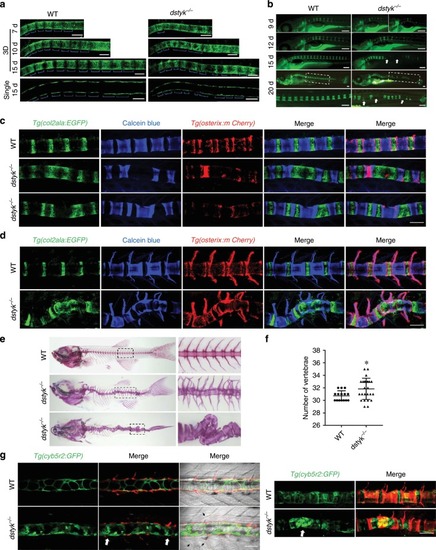
<italic>Dstyk</italic> regulates axial skeleton segmentation and spine formation.a Confocal images showing the notochord sheath cells of WT (left) and dstyk mutants (right) in Tg(col2a1a:EGFP) transgenic background from 7 to 15 dpf. Top three panel show the 3D view and bottom panel shows the single layer. The blue brackets indicate col2a1a positive domains. b Live images of Calcein staining for WT (left) and dstyk mutants (right) from 9 to 20 dpf. Boxed regions at about 20 dpf are magnified in the bottom panel. Note that wedge-shaped and mineralization defect vertebrae (white arrows) were shown in dstyk mutants. c, d Confocal images showing Calcein blue staining of Tg(col2a1a:EGFP);Tg(osterix:mCherry) double transgenic fish of WT and dstyk mutants at 20–25 dpf (c) and at 30–40 dpf (d). Note the disordered notochord sheath segmentation and curvature of the spine. e Lateral (middle) and dorsal view (bottom) of vertebral structure stained with Alizarin red for dstyk mutant zebrafish at about 1 month of age. WT (top) is shown the lateral view. Boxed regions are magnified in the right panel. f Graph depicting the counted number of vertebrae of WT (n = 15 independent embryos) and dstyk mutants (n = 25 independent embryos), *p < 0.05. p values were determined by unpaired two-tailed Student’s t-test. g Confocal images show the notochord cell of WT and dstyk mutants in Tg(cyb5r2:GFP) transgenic background and in vivo skeletal staining of centra with Alizarin red at 20–25 dpf. Left panel shows the single layer and right panel shows the 3D view. White arrows show the severe vacuole biogenesis defect. Black arrowheads show somite boundaries in mutants were not as sharp and straight as those in WT. Data are presented as mean ± SD. Scale bar represent 100 μm in (a, c, d and g), 200 μm in (b). Source data are provided as a Source Data file.
|