
FIGURE
Figure 4
- ID
- ZDB-FIG-200124-45
- Publication
- Serobyan et al., 2020 - Transcriptional adaptation in Caenorhabditis elegans
- Other Figures
-
- Figure 1
- Figure 1—figure supplement 1.
- Figure 1—figure supplement 2.
- Figure 1—figure supplement 3.
- Figure 2
- Figure 2—figure supplement 1.
- Figure 3
- Figure 3—figure supplement 1.
- Figure 3—figure supplement 2.
- Figure 3—figure supplement 3.
- Figure 4
- Figure 4—figure supplement 1.
- Figure 4—figure supplement 2.
- Figure 4—figure supplement 3.
- Figure 5
- Figure 5—figure supplement 1.
- All Figure Page
- Back to All Figure Page
Figure 4
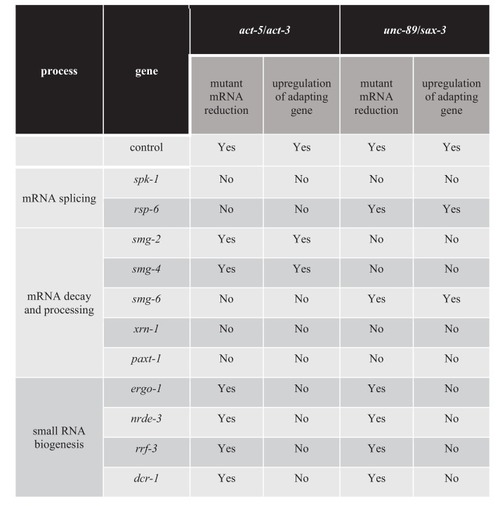
List of genes and RNAi clones tested in the screen; average dCt values of qPCR analyses of act-5 and act-3 mRNA levels in WT and act-5 mutants as well as of unc-89 and sax-3 mRNA levels in WT and unc-89 mutants. |
Expression Data
Expression Detail
Antibody Labeling
Phenotype Data
Phenotype Detail
Acknowledgments
This image is the copyrighted work of the attributed author or publisher, and
ZFIN has permission only to display this image to its users.
Additional permissions should be obtained from the applicable author or publisher of the image.
Full text @ Elife