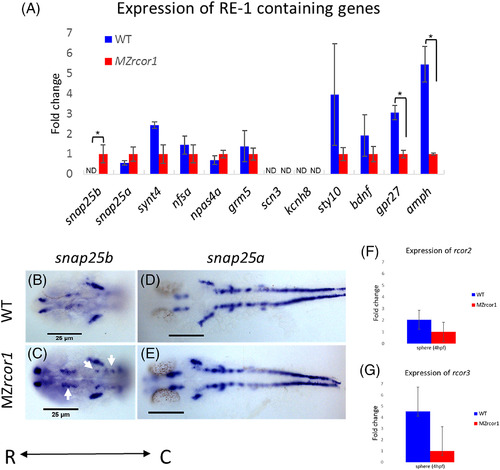
Expression analysis of Rest target genes in MZrcor1 mutants. A. qPCR analysis of RE‐1 containing genes in MZrcor1 mutantscompared to related wild‐type control embyos at 4 hpf. Increased expression of snap25b is observed in MZrcor1mutants, but no significant differences in expression level is seen in snap25a, synt4, nfsa, npas4a, grm5, scn3, kcnh8, sty10, and bdnf, while decreased expression of gpr27 and amph is observed in MZrcor1 mutant embryos MZrcor1 mutant expression is set to 1 because some markers are not detectable (ND) in wild‐types. B‐E. RNA in situ hybridization at 24 hpf showing ectopic expression of snap25b in the hindbrain of MZrcor1 mutants (indicated by arrowheads) (seen in 6/10) (B,C) and comparable snap25a expression in MZrcor1 mutants and wild‐type controls (D,E). qPCR analysis of rcor2 and rcor3 expression in MZrcor1mutants showed no compensatory increases when compared to wild‐type controls at 4 hpf (F,G) (*P < .05) (scale bar = 25 µm). hpf, hours postfertilization; qPCR, quantitative real‐time PCR
|
