
FIGURE
Figure 3
- ID
- ZDB-FIG-191230-943
- Publication
- Kobayashi et al., 2019 - Enrichment of hematopoietic stem/progenitor cells in the zebrafish kidney
- Other Figures
- All Figure Page
- Back to All Figure Page
Figure 3
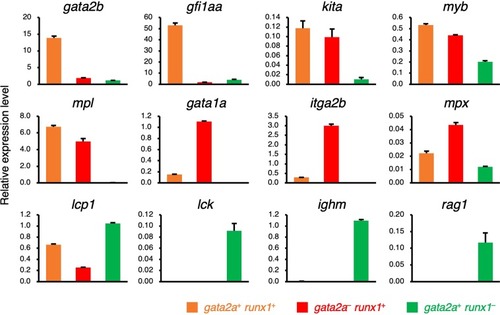
Expression of hematopoietic marker genes in HSPC populations. Relative expression levels of hematopoietic marker genes are shown. Orange, red, and green bars denote |
Expression Data
Expression Detail
Antibody Labeling
Phenotype Data
Phenotype Detail
Acknowledgments
This image is the copyrighted work of the attributed author or publisher, and
ZFIN has permission only to display this image to its users.
Additional permissions should be obtained from the applicable author or publisher of the image.
Full text @ Sci. Rep.