
Image
|
Figure Caption
Figure 3
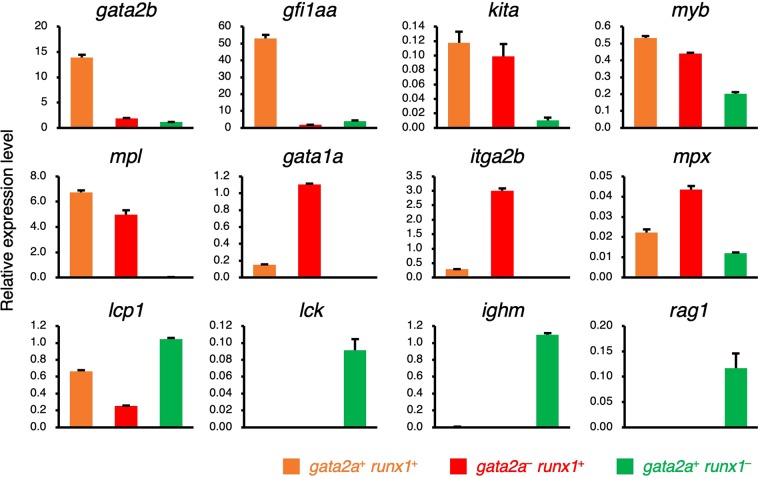
Expression of hematopoietic marker genes in HSPC populations. Relative expression levels of hematopoietic marker genes are shown. Orange, red, and green bars denote
Acknowledgments
This image is the copyrighted work of the attributed author or publisher, and
ZFIN has permission only to display this image to its users.
Additional permissions should be obtained from the applicable author or publisher of the image.
Full text @ Sci. Rep.