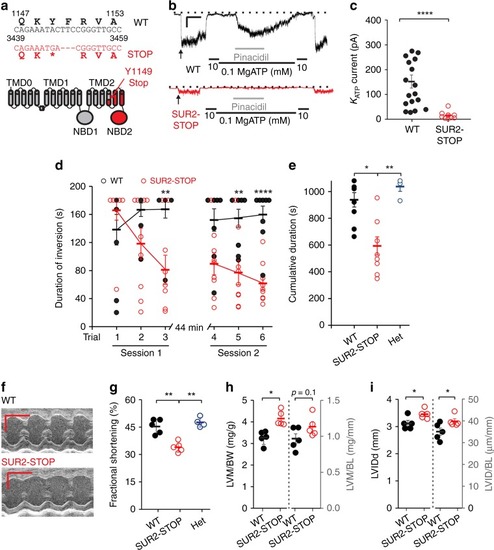
SUR2-STOP mice exhibit cardiac dysfunction and fatigability. a Top: The c.3446_3450delACTTCinsGA indel in ABCC9 and consequent premature stop codon following K1148 (p.Y1149Stop). Bottom: schematic of SUR2 with the site of the introduced Y1149Stop mutation in TM15 indicated and the downstream region in red. b Example current traces from inside–out voltage clamp recordings from ventricular myocytes of WT (black) or SUR2-STOP (red) mice (−50 mV holding potential in the presence and absence of MgATP and pinacidil as indicated). Scale bar shows 5 s (x-axis) and 25 pA (y-axis). c KATP channel current amplitudes from excised patches from mouse ventricular myocytes. The data shown from 18 patches for WT, and 10 patches for SUR2-STOP from ≥ 3 mice. ****p < 0.0001 (two-tailed t test). d Duration mice remained inverted during the multiple-trial inverted screen test. The data were analyzed using a repeated measures (rm) ANOVA model that contained one between-subjects variable (genotype) and two within-subjects variables (trials and sessions; see Supplementary Table 3 for summary statistics). The results from the rmANOVA revealed a significant genotype effect, as well as genotype x trial and genotype x session interactions. The data from nine WT and nine SUR2-STOP mice, *p-values for the pairwise comparisons exceeded Bonferroni correction (p < 0.008 [0.05/6]; *p < 0.05; **p < 0.01; ***p < 0.001). e) Cumulative inversion time, *p < 0.05 and **p < 0.01 according to one-way ANOVA and post hoc Tukey test. f Example M-mode echocardiography recordings from WT (top) and SUR2-STOP (bottom) mice. Scale bar shows 0.1 s (x-axis) and 1 mm (y-axis). g Ventricular fractional shortening measured from echocardiographic imaging (all echocardiographic data from five WT and five SUR2-STOP mice), **p < 0.01 (one-way ANOVA and post hoc Tukey test). h Left ventricular mass (LVM) as determined from echocardiography imaging normalized to body (LVM/BW) and body length (LVM/BL). *p < 0.05 (student’s t test). i Left ventricular internal diameter in diastole as measured from echocardiographic imaging. *p < 0.05 (student’s t test). The data from individual experiments shown as dots alongside mean ± SEM. Source data are provided as a Source Data file
|
