FIGURE SUMMARY
Title

ABCC9-related Intellectual disability Myopathy Syndrome is a KATP channelopathy with loss-of-function mutations in ABCC9

Authors
Smeland, M.F., McClenaghan, C., Roessler, H.I., Savelberg, S., Hansen, G.Å.M., Hjellnes, H., Arntzen, K.A., Müller, K.I., Dybesland, A.R., Harter, T., Sala-Rabanal, M., Emfinger, C.H., Huang, Y., Singareddy, S.S., Gunn, J., Wozniak, D.F., Kovacs, A., Massink, M., Tessadori, F., Kamel, S.M., Bakkers, J., Remedi, M.S., Van Ghelue, M., Nichols, C.G., van Haaften, G.
Source
Full text @ Nat. Commun.

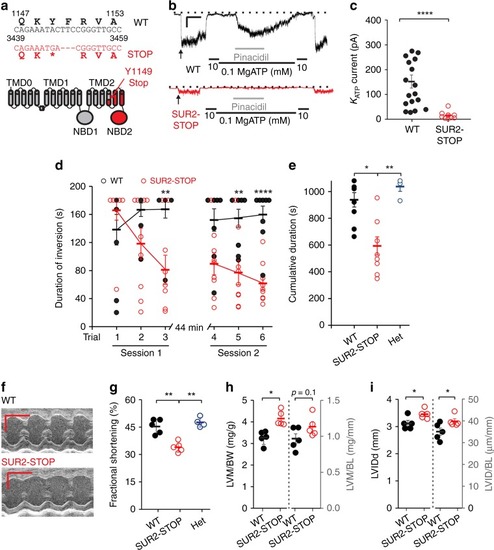
SUR2-STOP mice exhibit cardiac dysfunction and fatigability. a Top: The c.3446_3450delACTTCinsGA indel in ABCC9 and consequent premature stop codon following K1148 (p.Y1149Stop). Bottom: schematic of SUR2 with the site of the introduced Y1149Stop mutation in TM15 indicated and the downstream region in red. b Example current traces from inside–out voltage clamp recordings from ventricular myocytes of WT (black) or SUR2-STOP (red) mice (−50 mV holding potential in the presence and absence of MgATP and pinacidil as indicated). Scale bar shows 5 s (x-axis) and 25 pA (y-axis). c KATP channel current amplitudes from excised patches from mouse ventricular myocytes. The data shown from 18 patches for WT, and 10 patches for SUR2-STOP from ≥ 3 mice. ****p < 0.0001 (two-tailed t test). d Duration mice remained inverted during the multiple-trial inverted screen test. The data were analyzed using a repeated measures (rm) ANOVA model that contained one between-subjects variable (genotype) and two within-subjects variables (trials and sessions; see Supplementary Table 3 for summary statistics). The results from the rmANOVA revealed a significant genotype effect, as well as genotype x trial and genotype x session interactions. The data from nine WT and nine SUR2-STOP mice, *p-values for the pairwise comparisons exceeded Bonferroni correction (p < 0.008 [0.05/6]; *p < 0.05; **p < 0.01; ***p < 0.001). e) Cumulative inversion time, *p < 0.05 and **p < 0.01 according to one-way ANOVA and post hoc Tukey test. f Example M-mode echocardiography recordings from WT (top) and SUR2-STOP (bottom) mice. Scale bar shows 0.1 s (x-axis) and 1 mm (y-axis). g Ventricular fractional shortening measured from echocardiographic imaging (all echocardiographic data from five WT and five SUR2-STOP mice), **p < 0.01 (one-way ANOVA and post hoc Tukey test). h Left ventricular mass (LVM) as determined from echocardiography imaging normalized to body (LVM/BW) and body length (LVM/BL). *p < 0.05 (student’s t test). i Left ventricular internal diameter in diastole as measured from echocardiographic imaging. *p < 0.05 (student’s t test). The data from individual experiments shown as dots alongside mean ± SEM. Source data are provided as a Source Data file

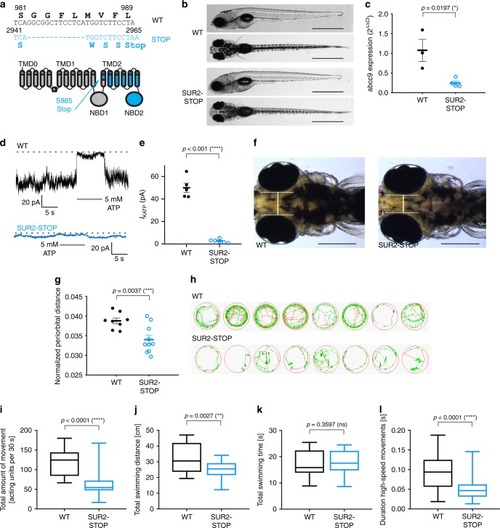
Hypotolerism and decreased locomotor behavior in SUR2-STOP zebrafish larvae. a The c.2944_2957del13 indel in abcc9 and consequent frameshift premature stop codon following S984 (p.S985Stop) and schematic of SUR2 with the site of the introduced S985Stop mutation in TM12 indicated, downstream region in blue. b Representative images illustrating the morphology of 5 dpf wild-type and SUR2-STOP mutants as seen from a left lateral (top) and dorsal view (bottom). Scale bars, 1 mm. c Quantitative RT-PCR to assess abcc9 expression in pools of 60 WT (three pools) and SUR2-STOP (four pools) embryos. d Representative current traces from inside–out patch clamp recordings from ventricular myocytes of WT (black; five patches) or SUR2-STOP (blue; six patches) zebrafish (−50 mV holding potential, ATP applied as indicated). e KATP channel currents from excised patches from zebrafish ventricular myocytes. The data from five patches (WT), and six patches (SUR2-STOP) from ≥ 3 zebrafish. f, g To assess hypotelorism, the distance between the convex tips of the eyes was measured and normalized to body length (WT, n = 8; HOM, n = 10). Scale bars, 200 μm. h Examples of movement traces shown in red, green, and black representing high-speed, intermediate, and slow movements, respectively. il Five-minute video recordings (n = 62 larvae per genotype) of 5 dpf homozygous SUR2-STOP fish and wild-type controls were analyzed for total amount of movement i, total swimming distance (TSD) j, total swimming duration k, and duration of high-speed movements l and compared with respective wild-type larvae. The data on the y-axis refer to the respective average value per 30-s (s) intervals. The data from four independent experiments (16 larvae per experiment) *p ≤ 0.05; **p ≤ 0.01; ***p ≤ 0.001; ****p ≤ 0.0001 (two-tailed unpaired Student’s t test or Mann–Whitney U test). The black horizontal bar indicates the mean value for each condition. Sample size, WT, n = 3; SUR2-STOP, n = 4 in c; WT, n = 5; SUR2-STOP, n = 5 in e; WT, n = 8; SUR2-STOP, n = 10 in g; WT, n = 62; SUR2-STOP, n = 62 in il. The data from individual experiments shown as dots alongside mean ± SEM. Source data are provided as a Source Data file

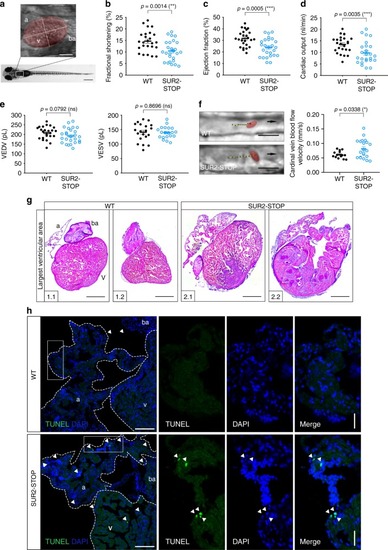
Systolic dysfunction and enlarged heart size in SUR2-STOP zebrafish. a Box designates imaged area to assess cardiac function. The ventricular area of the heart is highlighted, with the long axis and short axis of the ventricle indicated by dashed lines. be Quantification of cardiac function using individual characteristic confocal sections from a time series of the embryonic cardiac cycle at 5 dpf. f Tracking of individual red blood cells (RBCs) measuring cardinal vein blood flow velocity. RBCs were tracked for ten frames using ImageJ (NIH) and the plugin MTrackJ68. One representative image of each genotype is shown. Black arrow indicates the direction of RBC movement. g Heart histology of adult SUR2-STOP mutants and respective siblings after H&E staining. Exemplary depiction of 2 WT and 2 SUR2-STOP hearts. For assessment of ventricular chamber size, tissue sections showing the largest ventricular area were selected. h TUNEL assay on adult hearts to detect apoptotic cells (white arrowheads) in WT and SUR2-STOP fish. Heart chambers are indicated by white dashed line. Nuclei are stained with DAPI. All experiments were performed comparing SUR2-STOP and its WT siblings. For all graphs, significance was determined by two-tailed unpaired Student’s t test or Mann–Whitney two-tailed U test. Asterisks indicate statistical significance (*p ≤ 0.05; **p ≤ 0.01; ***p ≤ 0.001; ****p ≤ 0.0001). The black horizontal bar indicates the mean value for each condition. Sample size, WT, n = 20; SUR2-STOP, n = 20 in be; WT, n = 14; SUR2-STOP, n = 21 in f; WT, n = 6; SUR2-STOP, n = 6 in g and h. Scale bars, 1 mm and 50 μm in a; 10 μm in f, 500 μm in g; 100 μm (overview) and 50 μm (close up) in h. All embryos analyzed originated from group matings of adult zebrafish. a atrium, ba bulbous arteriosus, v ventricle. The data from individual experiments shown as dots alongside mean ± SEM. Source data are provided as a Source Data file

Acknowledgments
This image is the copyrighted work of the attributed author or publisher, and ZFIN has permission only to display this image to its users. Additional permissions should be obtained from the applicable author or publisher of the image. Full text @ Nat. Commun.