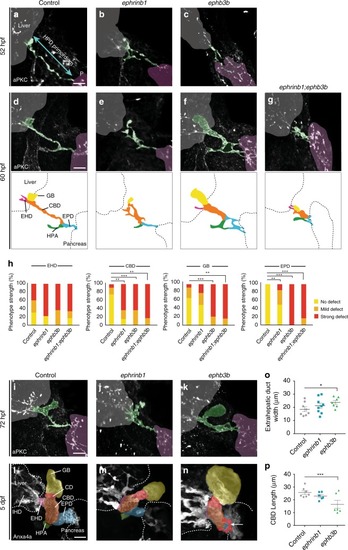
EphrinB1 and EphB3b control HPD remodeling in a spatiotemporal fashion. Compared to sibling controls at 52 hpf (a), emerging ducts are less mature in ephrinb1 mutants with more disconnected luminal pockets in EHB and HPA, visualized by apical aPKC (white, n = 16, N = 3) (b). c HPD luminal pockets are similarly disrupted in ephb3b mutants at 52 hpf, including the EPD (n = 17, N = 2). d Disconnected apical structures resolve into a single immature lumen by 60 hpf in controls (n = 29, N = 2). e Disrupted remodeling causes enlarged aPKC structures and luminal loops in all EHB domains in ephrinb1 mutants, while the EPD appears normal (n = 20, N = 2). f Resolution of apical structures in ephb3b mutants is compromised in all HPD domains, including the EPD (n = 12, N = 1). g All HPD domains exhibit defective tube remodeling in ephrinb1;ephb3b mutants (n = 7). Schematics (d–f) show HPD tube phenotypes at 60 hpf, see below for domain color-code. h Quantification of domain-specific HPD tube formation defects in controls (n = 12), ephrinb1 (n = 14), ephb3b (n = 14) and ephrinb1;ephb3b (n = 7) mutants at 60 hpf. i–n Early domain-specific defects persist in ephrinb1 and ephb3b mutants at 72 hpf (i–k; controls: n = 11, N = 2; ephrinb1: n = 5; ephb3b: n = 12, N = 1) and 5 dpf (l–n; control: n = 10, N = 2; ephrinb1: n = 6, N = 1; ephb3b: n = 10, N = 1). 30% ephb3b mutants show in addition ectopic ducts (red; white arrow) bifurcating from the main HPD. Quantification of EHD width (o) and CBD length (p) in ephrinb1 and ephb3b mutants at 5 dpf. l–n Anxa4 (gray) visualizes the HPD system at 5 dpf. HPD domains are color-coded based on morphological landmarks (e.g., HPA): EHD = pink; CD = red; gallbladder = yellow; CBD = orange; EPD = blue; HPA = green. Scale bar = 20 μm; n = sample number, N = number of experiments; Statistical test: h = Fisher Exact, o, p = Student’s t-test. Errors bar show SEM; *p < 0,05, ***p < 0,001. Liver and pancreas stainings for a–f and i–k are shown in Supplementary Fig. 2. Supplementary movies 1–4 and 8–10 show HPD phenotypes at 60 hpf and 5 dpf. Source data are provided as a Source Data file
|
