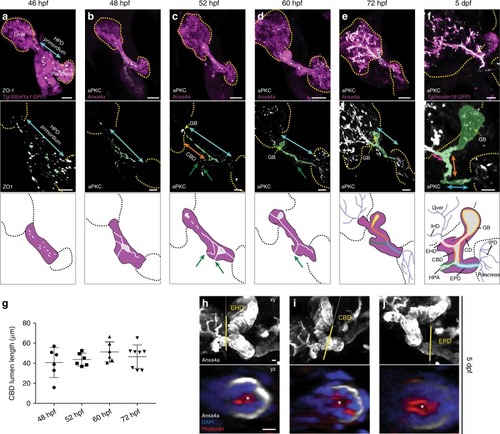
The HPD system forms by de novo tubulogenesis. a The forming HPD is visualized by pan-endodermal Tg(Xla.Eef1a1:GFP) (magenta) and ZO-1 (gray) labels the first junctional aggregates in the HPD primordium (blue arrow) at 46 hpf. b Ductal endoderm expression of Anxa4 (magenta) and apical aPKC (gray) visualize HPD morphology and nascent microlumina within the prospective CBD and EPD (n = 17, N = 3). c The HPD system elongates and the gallbladder anlage (yellow arrow) becomes detectable at 52 hpf. The immature EHB and HPA lumina show gaps and luminal loops compared to the EPD exhibiting a continuous immature lumen (n = 21, N = 3). The HPA connects at two points (green arrows). d At 60 hpf, all ductal compartments and a sphere-like gallbladder display a continuous emerging lumen, including a single connection of the HPA (green arrow), but excluding the EHD (n = 29, N = 2). See also Supplementary Movie 1. e Along organ growth, the HPD tubes start bending from 72 hpf. The emerging lumen formed in the HPD system is continuous and connected to both IHD and IPD luminal network (n = 11, N = 2) f transgenic keratin18:GFP expression visualizes the compact EHB and IHD at 5 dpf (n = 13, N = 4), see also Supplementary Movie 8. Schematic overviews of HPD differentiation (a–f): starting with junctional aggregates and resulting in a continuous lumen spanning the HPD system. From 52 hpf individual HPD compartments are distinguishable: extrahepatic duct (EHD, pink); cystic duct (CD, red); gallbladder (GB, yellow); common bile duct (CBD, orange); extrapancreatic duct (EPD, blue); hepatopancreatic ampula (HPA, green). Scale bars: a–f = 10 μm. g Lumen length quantification of the differentiating CBD between 48 and 72 hpf. h–j At 5 dpf, cortical actin indicates open lumina in the wild-type EHD, CBD and EPD; scale bars = 10 μm. Magnified cross-sections show open lumina (asterisk) of indicated ductal domains (yellow lines); scale bars = 5 μm. Error bars show SEM; n = sample number, N = number of experiments. Source data are provided as a Source Data file
|
