FIGURE

Figure 3

ID
ZDB-FIG-191230-777
Publication
Xie et al., 2019 - Experience-dependent development of visual sensitivity in larval zebrafish
Other Figures
All Figure Page
Back to All Figure Page
Figure 3

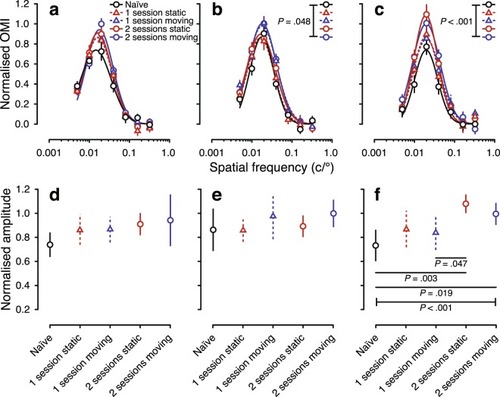
Spatial-frequency tuning from the optomotor response of visually naïve and experienced larval zebrafish at 7 dpf. The top row shows spatial-frequency tuning functions (mean ± SEM) at stimulus speeds of (a) 25 °/s (b), 50 °/s, and (c) 100 °/s. Black solid, red dashed, blue dashed, red solid and blue solid lines show functions for naïve, 1-session static, 1-session moving, 2-session static and 2-session moving groups, respectively. Tuning functions are a three-parameter log-Gaussian, fit by minimising the least-squares error. The bottom row shows normalised amplitude at stimulus speeds of (d) 25 °/s (e), 50 °/s, and (f) 100 °/s. Error bars show the 95% confidence intervals. P < 0.05 after Bonferroni correction was considered to be statistically significant.

Expression Data

Expression Detail
Antibody Labeling
Phenotype Data

Phenotype Detail
Acknowledgments
This image is the copyrighted work of the attributed author or publisher, and ZFIN has permission only to display this image to its users. Additional permissions should be obtained from the applicable author or publisher of the image. Full text @ Sci. Rep.