|
Figure 3
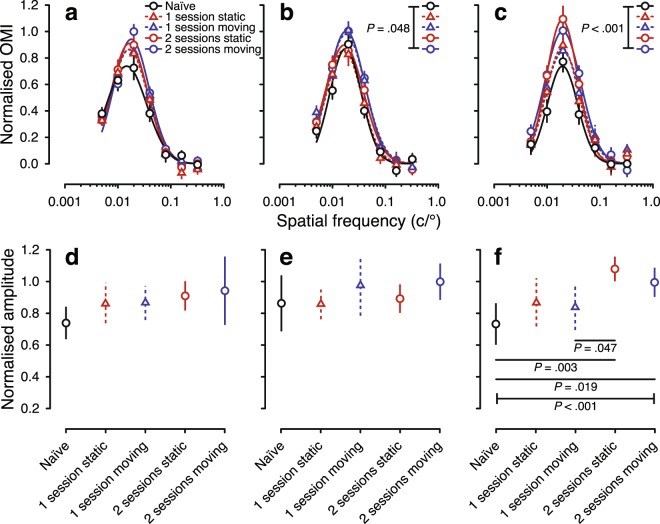
Spatial-frequency tuning from the optomotor response of visually naïve and experienced larval zebrafish at 7 dpf. The top row shows spatial-frequency tuning functions (mean ± SEM) at stimulus speeds of (

|
|
Figure 3
Spatial-frequency tuning from the optomotor response of visually naïve and experienced larval zebrafish at 7 dpf. The top row shows spatial-frequency tuning functions (mean ± SEM) at stimulus speeds of (