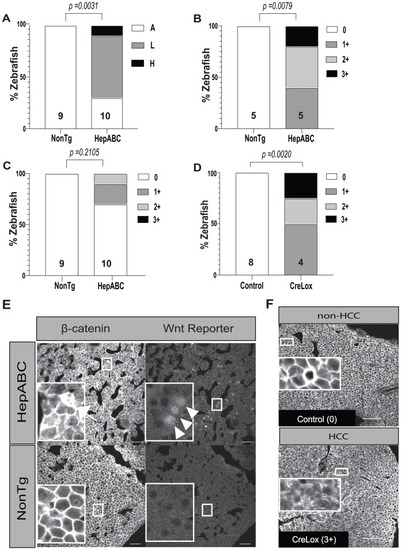
Heterogeneous Wnt reporter expression and β-catenin cytoplasmic localization in adult β-catenin-driven HCC. (A) Stacked bar graph showing analysis of Wnt reporter (7xTCF-Xla.Siam:mCherry) expression in liver tissue of Tg(fabp10a:flox-pt-β-cat) (HepABC) HCC and zebrafish livers of sibling controls lacking this transgene (NonTg). Wnt reporter expression was scored as: A, absent (no mCherry expression); L, low (mCherry expression in less than 10% of cells); or H, high (mCherry expression in greater than 10% of cells). P-values derived from Fisher's exact test comparing samples with (low or high) and without (absent) Wnt reporter expression. Graph shows data from one experiment. (B,C) Stacked bar graphs showing quantification of β-catenin localization by immunofluorescence staining performed on paraffin-embedded sections (B) or cryosections (C) in HepABC HCC and NonTg zebrafish livers. Samples were scored based on amount of cytoplasmic staining: 0, no cytoplasmic staining; 1+, focal (<10%) weak to moderate cytoplasmic staining; 2+, focal strong cytoplasmic staining or patchy (10–50%) weak to moderate cytoplasmic staining; 3+, diffuse (>50%) cytoplasmic staining. P-values derived from Fisher's exact test comparing samples with membrane staining only (0+) to those with cytoplasmic staining (1+ to 3+). Each experiment was performed once. (D) Stacked bar graph showing quantification of β-catenin localization in 6-mpf CreLox zebrafish with HCC and control siblings without HCC lacking either the Cre driver or lox-switch transgene [Tg(fabp10a:flox-pt-β-cat) and Tg(fabp10a:CreERT2), control]. Numbers above x axis indicate the sample size for each group. P-values determined by Fisher's exact test. Experiment was performed once. (E) Representative β-catenin and Wnt reporter images of cryosections from a HepABC liver diagnosed as HCC (top panels) and a NonTg liver diagnosed as no/minimal changes (bottom panels). Arrow indicates a cell with cytoplasmic β-catenin localization; white arrowheads indicate Wnt reporter expression. Scale bars: 30 µm. Insets contain 5× magnified images of regions of tissue in smaller boxes for each image. (F) Representative immunofluorescence images of β-catenin staining. Control zebrafish showed membrane staining only, whereas CreLox zebrafish with HCC showed varying degrees of cytoplasmic staining. Scale bars: 50 µm. In each image, large inset box is 5× magnification of small box.
|
