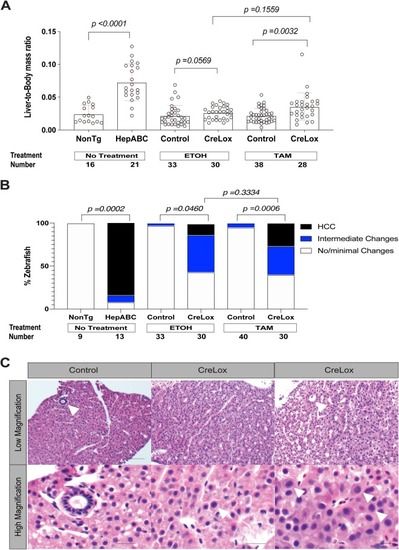
Switching on activated β-catenin (ABC) in larval zebrafish results in hepatocellular carcinoma (HCC) in adult zebrafish. CreLox [Tg(fabp10a:CreERT2); Tg(fabp10a:flox-pt-β-cat)] zebrafish and control siblings lacking either the Cre driver or lox-switch transgene [Tg(fabp10a:flox-pt-β-cat) and Tg(fabp10a:CreERT2), control], were treated with 4-hydroxytamoxifen (TAM) or vehicle control (ethanol, EtOH) from 3 to 6 dpf. Livers were weighed and examined microscopically 6 months later alongside livers from non-transgenic (NonTg) and Tg(fabp10a:pt-β-cat) (HepABC) zebrafish. Data were pooled from two experiments for NonTg and HepABC groups and from five experiments for control and CreLox groups treated with ETOH or TAM. (A) Scatter plot showing liver mass normalized to total body mass, ±s.d. P-values derived from Kruskal–Wallis non-parametric ANOVA followed by Dunn's multiple comparisons test. (B) Stacked bar graph showing the percentage of zebrafish per tested group categorized as no/minimal changes, intermediate changes, or HCC. P-values derived using Fisher's exact test comparing samples with and without HCC. (C) Representative H&E stained histological images from TAM-treated zebrafish. Left panels: control liver showing normal architecture with scattered bile ducts (arrowhead, top panel) and round, smooth, similarly sized nuclei (bottom panel); it was scored as no/minimal changes. Middle panels: CreLox liver showing minimal architectural abnormalities (top panel) and mild cytologic abnormalities including focal nuclear enlargement (arrowhead, bottom panel); it was scored as intermediate changes. Right panels: CreLox liver with moderate architectural abnormalities including pseudoglands (arrowhead, top panel) and moderate cytologic abnormalities including enlarged irregularly shaped nuclei (arrowheads, bottom panel); it was scored as HCC. Scale bars: 20 µm (top panels) and 10 µm (bottom panels).
|
