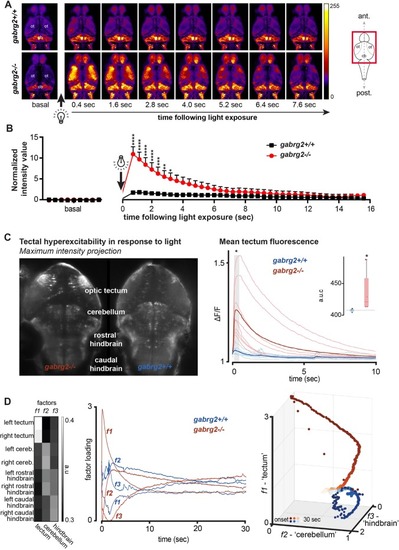
Calcium imaging reveals broad neuronal activity triggered by light in gabrg2−/−larvae. (A) Tg(neurod:GCaMP6f)+/− and gabrg2+/− were intercrossed, and neuronal activity was monitored under a confocal microscope (2.5 Hz) at 5 dpf. After a period of >30 min in complete darkness, switching on the laser induced a broad neuronal activity in both optic tecta in gabrg2−/− (n=8) compared to gabrg2+/+ siblings (n=7). ot, optic tectum; cb, cerebellum. (B) Fluorescence quantification in the optic tecta before and after laser exposure shows a significant increase of fluorescence in gabrg2−/− larvae compared to wild-type siblings. Each point corresponds to the relative quantification of fluorescence from a frame with 400-ms exposure. (****P<0.0001, ***P<0.001, **P<0.01, *P<0.05, two-way ANOVA). (C) Single-plane light-sheet microscopy revealed marked hyperexcitability in the tectum in gabrg2−/− fish. The left shows a maximum intensity projection of representative knock-out and wild-type larval fish recordings. The optic tectum shows a marked bilateral increase in fluorescence in the KO, with a much smaller response in the wild-type fish. The right shows ΔF/F normalized fluorescence intensity for 10 s after switching on visible light, with an early difference in the average amplitude of wild-type and KO tectal fluorescence. Inset shows area under the curve (a.u.c.) of the fluorescence traces from onset to 10 s. (D) A non-negative matrix factorization of regionally averaged fluorescence traces. The factor weights show distinct response patterns for bilateral tectum, bilateral cerebellum/rostral hindbrain and bilateral hindbrain regions (left), with distinct temporal profiles of the loading of these three factors (middle plot). In three-dimensional factorized state-space, there is a clear separation of wild-type and gabrg2−/− responses early after being exposed to visible light.
|
