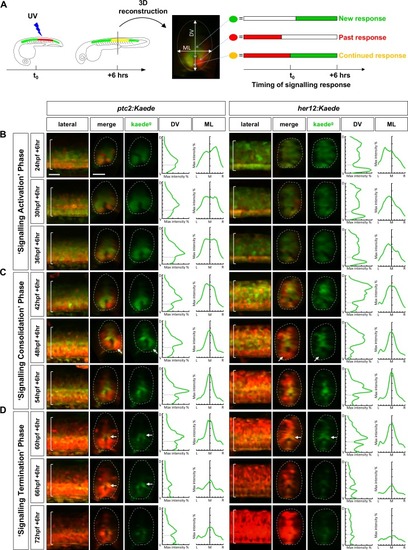
Figure 2—figure supplement 1.

PHRESH signalling profiles show similar trends across multiple embryos.

ptc2:Kaede and her12:Kaede embryos were photoconverted at 24 hpf (A), 48 hpf (B) and 72 hpf (C) and imaged 6 hr post-conversion. Each line (grey) represents Kaedegreen fluorescent intensity along the mediolateral or dorsoventral axis (see Figure 2A) of one embryo. The red line denotes the average profile of all embryos (n = 4). The max intensity axes are 0–50%, while the DV/ML axes display the full extent of the transverse section. The position of the spinal canal in the dorsoventral profiles is denoted by a dotted line. (A) The signalling profiles during the ‘signalling activation’ phase. (B) The signalling profiles during the ‘signalling consolidation’ phase. (C) The signalling profiles during the ‘signalling termination’ phase. (D) The average profiles of all three phases plotted together. The relevant spinal canal position in the dorsoventral profile is marked by the matching coloured dotted line.

Expression Data

Expression Detail
Antibody Labeling
Phenotype Data

Phenotype Detail
Acknowledgments
This image is the copyrighted work of the attributed author or publisher, and ZFIN has permission only to display this image to its users. Additional permissions should be obtained from the applicable author or publisher of the image. Full text @ Elife