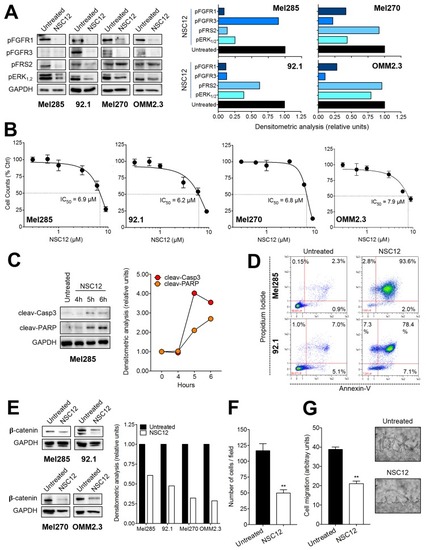
Effect of the pan FGF-trap NSC12 on human UM cells. (A) Western blot analysis of the phosphorylation of FGFR1 and FGFR3 and of the downstream signaling proteins FRS2 and ERK1/2 in Mel285, 92.1, Mel270, and OMM2.3 cells after 3 h treatment with 15 µM NSC12. (B) Effect of NSC12 treatment on the proliferation of UM cells. Viable cells were counted after 24 h of incubation with increasing concentrations of NSC12. Data are the mean ± SEM (n = 3). (C) Kinetics of PARP and caspase-3 cleavage following incubation of MEL285 cells with 15 µM NSC12. (D) Cytofluorimetric analysis of apoptosis induced in Mel285 cells (upper panels) and 92.1 cells (lower panels) after 12 h treatment with 15 µM NSC12. (E) Western blot analysis of the levels of β-catenin in Mel285, 92.1, Mel270, and OMM2.3 cells after 3 h treatment with 15 µM NSC12. (F) Boyden chamber chemotaxis assay performed on Mel285 cells treated for 4 h with 6.0 µM NSC12. Data are the mean ± SEM of five fields for each triplicate sample. (G) A mechanical wound was performed in a Mel285 cell monolayer followed by 18 h incubation with 6.0 µM NSC12. After 18 h, cell migration at the leading edge of the wound was quantified by computerized image analysis. Representative images of untreated and NSC12-treated cells are shown on the right (black lines highlight the front of cell migration). Data are the mean ± SEM of 6 microscopic fields. In (A,C,D) the right panel shows the densitometric analysis of immunoreactive bands normalized to GAPDH protein levels. ** p < 0.01, Student’s t test.
|
