
Fig. 6
- ID
- ZDB-FIG-191210-4
- Publication
- Cokus et al., 2019 - Tissue-Specific Transcriptomes Reveal Gene Expression Trajectories in Two Maturing Skin Epithelial Layers in Zebrafish Embryos
- Other Figures
- All Figure Page
- Back to All Figure Page
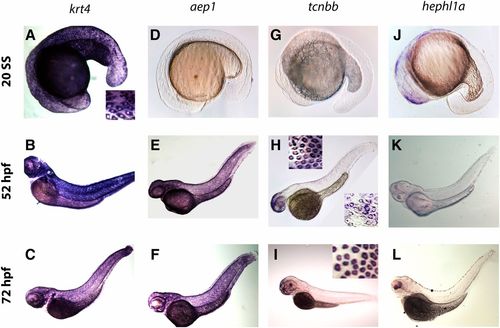
Expression patterns of four skin-enriched genes detected by in situ hybridization. A–C) krt4 was highly expressed at all three stages (20 SS, 52 hpf, and 72 hpf). The inset in (A) shows an enlarged image of krt4 expression in skin. D–F) aep1 was only expressed highly at the two later stages (52 and 72 hpf). G–I) tcnbb was only highly expressed at 52 and 72 hpf. The top inset in (H) displays tcnbb expression in skin covering the head region, while the bottom inset shows expression in skin at the trunk region. The inset in (I) shows an enlarged image of tcnbb expression in skin at the anterior end. J–L) hephl1a expression was detected at 20 SS in skin, but not later stages. All images are oriented with dorsal to the top, ventral to the bottom, anterior to the left, and posterior to the right. |
| Genes: | |
|---|---|
| Fish: | |
| Anatomical Term: | |
| Stage Range: | 20-25 somites to Protruding-mouth |