
Fig. S1
- ID
- ZDB-FIG-191007-5
- Publication
- Kunst et al., 2019 - A Cellular-Resolution Atlas of the Larval Zebrafish Brain
- Other Figures
- All Figure Page
- Back to All Figure Page
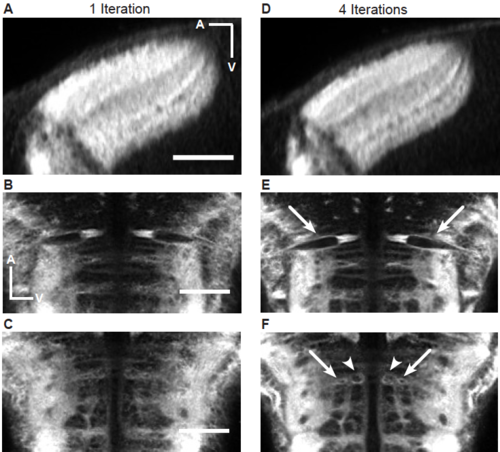
Improvement of granularity of the shape-based average brain after multiple iterations. (A-C) Single optical slices through the tectum (A) and the hindbrain (B and C) after one iteration. All scale bars represent 50 μm. (D-E) Single optical slices through the tectum (A) and the hindbrain (B and C) after four iterations. In the case of the tectum, individual tectal layers become more obvious and clearer after 4 iterations compared to one. Arrows in (B) highlight the Mauthner cells. Arrows and arrowheads in (C) highlight additional identifiable reticulospinal neurons. In both cases the neurons become either more sharply defined (B), or in the case of (C), only are recognizable after multiple iterations. |