
Fig. 1
- ID
- ZDB-FIG-191007-4
- Publication
- Kunst et al., 2019 - A Cellular-Resolution Atlas of the Larval Zebrafish Brain
- Other Figures
- All Figure Page
- Back to All Figure Page
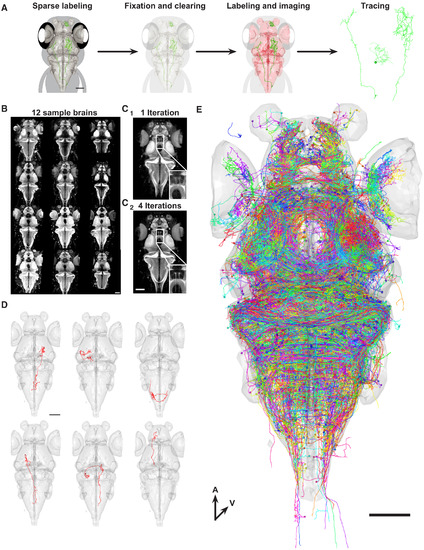
Construction of a Single-Neuron Atlas (A) Workflow for generating single-neurons tracings. (B) Images of 12 representative brains used to generate a shape-based average template. Brains were labeled with an antibody against the presynaptic protein Synapsin. (C) Shape-based average template brain after 1 iteration (C1) and 4 iterations (C2). Inset shows higher magnification of the torus longitudinalis neuropil. (D) Examples of individually traced neurons from different brains aligned to our template brain (gray surface). (E) Overlay of all neurons (n = 1,955) generated by our workflow. Colors of neurons are assigned randomly. All scale bars represent 100 μm. |