
Fig. S1
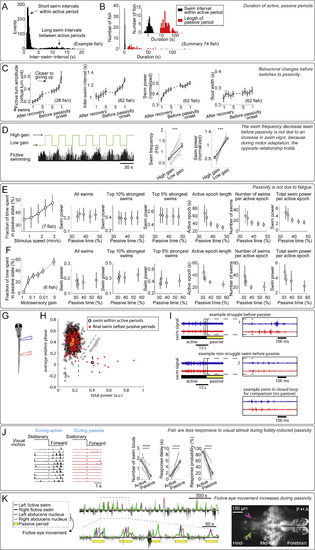
Higher-Order Behavioral Effects of Futility-Induced Passivity, Related to Figure 1 (A and B) Distribution of inter-swim intervals in open-loop. Intervals followed a bimodal distribution: short swim intervals occurred within the active period when fish swam once every 1-2 s, and long swim intervals occurred between active periods when the fish stopped swimming (defined as the ‘passive period’). (A) Distribution of all inter-swim-intervals from an example fish. (B) Distribution of average inter-swim-intervals during classified active periods (black bars), and average duration of passive periods (red bars) across fish. (C) Over the course of an active period in open-loop, the animals: 1. made larger turns, and turning amplitude was largest just before passivity onset; 2. swam less frequently, and the longest interval between swims happened just before passivity onset; 3. swam more vigorously, and swimming was on average strongest just before passivity onset; 4. but the duration (width) of swim bouts was not strongly modulated. Error bars, SEM. (D) Decrease in swim frequency (seen before passivity in C) is not due to an increase in swim power, control for Figure 1I. (Left) Motor adaptation assay; low motosensory gain in a closed-loop environment led to more powerful swimming. (Right) During low motosensory gain, swim frequency and swim power were both elevated compared to during high motosensory gain. Therefore, the decrease in swim frequency observed as the animal approaches passivity (Figure 1I) was not simply due to a concurrent increase in swim power. (Two-tailed paired t test, ∗∗∗p < 0.001, p = 8.9 × 10⁻⁶ for swim frequency, p = 2.7 × 10⁻⁶ for normalized swim power. Error bars, SEM) (E and F) Effects of stimulus velocity and motosensory gain on futility-induced passivity imply that passivity was unlikely to be caused by fatigue. More passivity was caused by (E) faster forward-moving visual stimulus in open loop, or (F) lower motosensory gain in closed loop. Under those conditions, increased occurrence of passivity was not due to more vigorous or more frequent swimming because: similar swim power of individual swims was observed for different velocities or gains, as well as of the top 10% strongest swims and the top 5% strongest swims. On the contrary, more passivity can be associated with smaller amounts of total swim output: shorter active periods, fewer swim attempts, and less total swim power. Together, these results imply that passivity was not caused by fatigue. Error bars, SEM. (G–I) During transitions from active periods to passive periods, fish occasionally struggle. (G) Experimental setup showing placement of an electrode pair, recording electrical signals from the same side but different segments of the tail (Liao and Fetcho, 2008). (H) Struggles can be identified by the relative phase difference between anterior and posterior electrodes, and power per burst. Final swims before passivity can be non-struggle swims or struggles. On average 13 ± 9% of switches are preceded by a struggle (identified by burst power, n = 5 fish, mean ± SEM). (I) Example of switches preceded by a struggle (top), non-struggle swim (middle), and for comparison, closed-loop swimming (bottom). (J) Fish were less responsive to visual stimuli during the passive periods. In an assay where, first, passivity was elicited by the usual paradigm, then a static stimulus was presented (2 s), and then pulse of visual motion was presented (2 s), the animals responded far less to the motion pulse if they were in the passive behavioral state. (Two-tailed paired t test, ∗∗∗∗p < 0.0001, p = 2.6 × 10⁻⁶ for swim bout number change, p = 3.8 × 10⁻⁵ for response delay, p = 4.2 × 10⁻⁷ for response probability. Error bars, SEM) Same data as in Figure 1K. (K) During the passive periods, calcium activity was seen in neurons in the abducens nucleus (arrows) in animals expressing nuclear-localized GCaMP6f (Tg(elavl3:H2B-GCaMP6f)) imaged with a light-sheet microscope. Neurons in the abducens nucleus are known to drive eye movement. Thus, increased activity in this area, alternating between left and right, implies that animals were attempting to move their eyes during the passive periods. |
Reprinted from Cell, 178(1), Mu, Y., Bennett, D.V., Rubinov, M., Narayan, S., Yang, C.T., Tanimoto, M., Mensh, B.D., Looger, L.L., Ahrens, M.B., Glia Accumulate Evidence that Actions Are Futile and Suppress Unsuccessful Behavior, 27-43.e19, Copyright (2019) with permission from Elsevier. Full text @ Cell