
Fig. S2
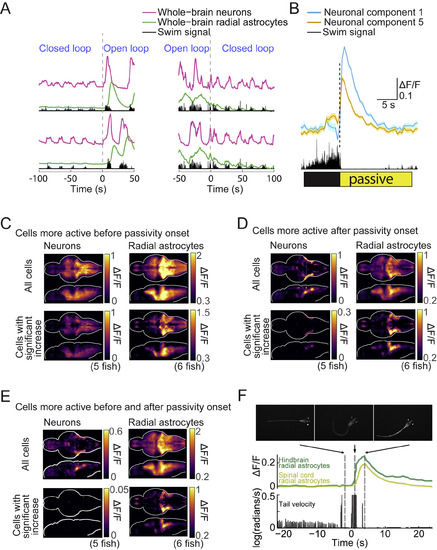
Whole-Brain Activity Elevation before and after Passivity Onset in Both Paralyzed and Non-paralyzed Fish and Passivity in Non-paralyzed Fish, Related to Figure 2 (A) Neuronal and astrocytic activity near the time of open-loop onset (left), and closed-loop onset (right). Signals are averaged across all the neurons or all the radial astrocytes in the brain, and two switches from each type are shown (top and bottom). Neurons showed stronger activity fluctuations during open-loop than during closed-loop, but showed clear activity patterns in both scenarios. In contrast, astrocytic activity fluctuations (calcium) were small before open-loop, but increased before and during passivity. Signals are z-scored. (B) Average activity of neuronal component 1 and component 5, from the same fish in Figure 2H, triggered by passivity onset. Each trace is the average of 42 switches from active to passive states. Shading represents SEM. (C–E) Whole-brain neuronal and astrocytic maps for cells showing activity elevation in windows before, after, or both before and after passivity onset (average over 5 fish for neuronal imaging, 6 for astrocytic imaging). Average ΔF/F signals from cells statistically increasing their activity relative to baseline (Methods), (C) before passivity onset (−1 to 0 s). (D) after passivity onset (+1 to 4 s). (E) both before and after passivity onset (−1 to 0 s and +1 to 4 s). For each panel, top rows show average activity from all cells, and bottom rows show average activity only from cells with significant activity elevation. (F) A zebrafish, expressing GCaMP6f in radial astrocytes, was placed in agarose. The agarose was slowly coagulating, but never fully prevented tail motion. The fish attempted to swim and the viscous agarose prevented the movement, qualitatively mimicking a reduction in motosensory gain. The animals displayed similar passivity as in the virtual reality assay. Calcium levels followed a similar pattern as was seen in futility-induced passivity in virtual reality. Calcium activity also increased in the spinal cord, but with a delay. |
Reprinted from Cell, 178(1), Mu, Y., Bennett, D.V., Rubinov, M., Narayan, S., Yang, C.T., Tanimoto, M., Mensh, B.D., Looger, L.L., Ahrens, M.B., Glia Accumulate Evidence that Actions Are Futile and Suppress Unsuccessful Behavior, 27-43.e19, Copyright (2019) with permission from Elsevier. Full text @ Cell