
Fig. S1
- ID
- ZDB-FIG-190925-29
- Publication
- Kramer et al., 2019 - Neuronal Architecture of a Visual Center that Processes Optic Flow
- Other Figures
- All Figure Page
- Back to All Figure Page
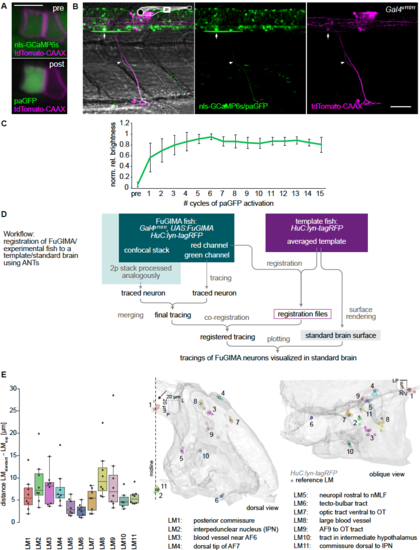
Characterization of paGFP activation in . single cells, registration procedure of tracings and alignment precision of landmarks. (A) Application of the FuGIMA photoactivation protocol in a single spinal cord neuron coexpressing UAS:FuGIMA and UAS:tdTomato-CAAX (driver: Gal4s1101t). Photoactivation in a single spinal cord neuron, pre- and post-photoactivation with a single activation cycle (brightness/contrast adapted separately). (B) Lateral views of the tail with the photoactivated neuron extending from the spinal cord after full photoactivation protocol of 15 cycles. (Inset: rectangle on fish schematic indicates the field of view. Green: nls-GCaMP6s/paGFP, magenta: tdTomato-CAAX, white arrow: soma of photoactivated neuron, arrowhead: filled neurite). (C) Time course of paGFP brightness in the soma over the course of 15 cycles of photoactivation (n = 5 pretectal neurons in 3 fish, mean +/- STD). (D) Workflow of image registration enabling visualization of FuGIMA neurons in the standard brain. Experimental z stacks are split into two separately processed channels. Neurons are traced in the nls-GCaMP6s/paGFP channel and tracings of neurons imaged at both the two-photon (2p) and the confocal microscope are merged. In parallel, the reference marker channel (HuC:lyn-tagRFP) is registered to the standard brain (averaged HuC:lyn-tagRFP). The resulting registration files are applied to tracings (coregistration), enabling their visualization within the volume of the standard brain. (E) Quantification of distances between the location of landmarks in the standard brain and in the registered experimental fish. Left: combined box plot and swarm plot (middle horizontal line: median, horizontal box outlines: first and third quartile, whiskers: last points included in 1.5 * interquartile range from the respective quartile), right: 3D rendering of landmarks in the standard brain (gray surface: reference marker HuC:lyn-tagRFP, dark gray: landmark position in standard brain, colors: registered landmarks from experimental fish, n = 8 z stacks from 6 fish for LM 1 – 9 and 11, n = 6 z stacks from 4 fish for LM 10, middle: dorsal view, black arrow: viewing direction for lateral view, shown on the right, LM, landmark). Scale bar: 5 μm in (A), 50 μm in (B). |