
Fig. 4
- ID
- ZDB-FIG-190919-11
- Publication
- Costa et al., 2019 - Impaired Mitochondrial ATP Production Downregulates Wnt Signaling via ER Stress Induction
- Other Figures
- All Figure Page
- Back to All Figure Page
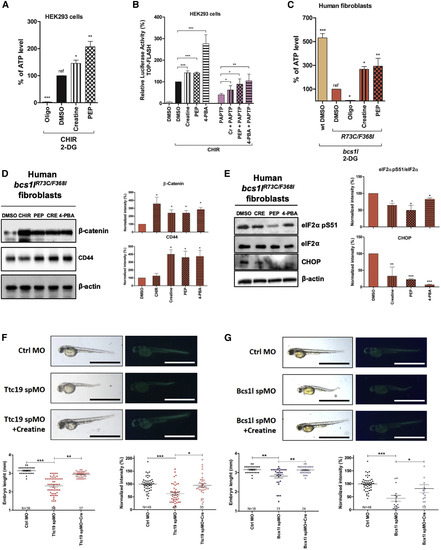
Increased Mitochondrial ATP Production or Endoplasmic Reticulum Stress Inhibition Rescues Wnt Signaling (A) Mitochondrial ATP content was measured in HEK293 cells, after treatment with 1 mM creatine (CRE) or 60 μM phosphoenolpyruvate (PEP) for 30 min. Furthermore, Wnt signaling was induced by co-administration of 3 μM CHIR. The analysis was conducted as in Figure 2A (n = 3; means ± SEMs). (B) Canonical Wnt signaling activity based on TCF-LEF-dependent transcription was assayed in HEK293 cells, as in Figure 1A. Cells were pre-treated for 30 min with CRE or phosphoenolpyruvate or for 2 h with 0.5 mM of the endoplasmic reticulum stress inhibitor 4-phenyl butyric acid (4-PBA) before addition and incubation with or without 1 μM PAPTP for a further 8 h (n = 3; means ± SEMs). (C) Mitochondrial ATP was measured and analyzed in human immortalized fibroblasts from healthy donors (WT) or a GRACILE patient (n = 3). Cells were pre-treated as in (A). (D) β-Catenin and CD44 recovery were measured in bcs1lR73C/F368I fibroblasts by western blot after treatment with the following compounds: 3 μM CHIR, 1 mM CRE, 0.6 mM phosphoenolpyruvate, or 0.5 mM 4-PBA. (E) Endoplasmic reticulum stress rescue was measured in bcs1lR73C/F368Ifibroblasts. Representative blots are shown at left, while the quantification is reported at right (n = 3; means ± SEMs). (F and G) Zebrafish morphants for Ttc19 (F) and Bcs1l (G) were obtained as in Figures 3C and 3E. Bright-field images of morphants as well as reporter GFP epifluorescence are shown. The sagittal length and GFP epifluorescence quantification of embryos are reported in the graph below (means ± SEMs; dots and numbers represent treated embryos). Bars, 1.5 mm. Statistical significance (ANOVA) was determined as ∗p < 0.05, ∗∗p < 0.01, and ∗∗∗p < 0.001. |
| Gene: | |
|---|---|
| Fish: | |
| Condition: | |
| Knockdown Reagents: | |
| Anatomical Term: | |
| Stage: | Long-pec |
| Fish: | |
|---|---|
| Condition: | |
| Knockdown Reagents: | |
| Observed In: | |
| Stage: | Long-pec |