
FIGURE
Fig. 4
- ID
- ZDB-FIG-190822-25
- Publication
- Fischer et al., 2019 - FoxH1 represses miR-430 during early embryonic development of zebrafish via non-canonical regulation
- Other Figures
- All Figure Page
- Back to All Figure Page
Fig. 4
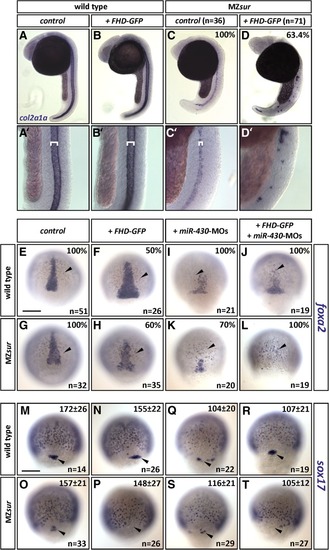
FHD-GFP interferes with severity of the MZsur mutant phenotype. a–dWild-type (a, b) and MZsur mutant (c, d) embryos at 24hpf. col2a1a in-situ staining in wild-type (un-injected control (a) or injected with FHD-GFP (b)) shows wild-type notochord of expected width (white brackets in enlarged sections a′ and b′). In uninjected MZsur embryos the width is reduced (c′). Injection of FHD-GFP in MZsur mutants enhances the phenotype (d/d′; note reduced size and additionally discontinuity of staining). e–l foxa2 in-situ hybridizations show reduction of axial mesoderm formation in MZsurmutants. Injection of FHD-GFP causes a broadened axial signal in 50% of wild type embryos, but no reduction of axial cells (f), and strengthens the effect in 60% of the MZsur mutants (h). dre-miR-430 morpholinos (MOs) massively reduce axial foxa2 signals in both genotypes (l, k). Co-injection of FHD-GFP and MOs also results in a decreased staining (j, l) when compared to FHD-GFP injection (f, h). Percentage of embryos showing the same phenotype as in the image is given (upper right). m–t sox17 in-situ hybridizations show only slight reduction of endoderm after injection of MOs (q–t). Number of forerunner cells (black arrow) is reduced in MZsurcontrol and after MOs injections (o, q, s). FHD-GFP lead to complete loss of forerunner cells (black arrow) in the majority of MZsur embryos (p, t; see also Additional file : Statistical analysis of forerunner cells). Numbers of sox17-positive cells seen in dorsal view and standard deviation are given (upper right) as well as number of analyzed embryos (n) (lower right). Size bars: 200 μm. γ value was changed to 0.8 in each picture |
Expression Data
| Genes: | |
|---|---|
| Fish: | |
| Knockdown Reagents: | |
| Anatomical Terms: | |
| Stage Range: | 30%-epiboly to Prim-5 |
Expression Detail
Antibody Labeling
Phenotype Data
| Fish: | |
|---|---|
| Knockdown Reagents: | |
| Observed In: | |
| Stage Range: | 30%-epiboly to Prim-5 |
Phenotype Detail
Acknowledgments
This image is the copyrighted work of the attributed author or publisher, and
ZFIN has permission only to display this image to its users.
Additional permissions should be obtained from the applicable author or publisher of the image.
Full text @ BMC Biol.