
FIGURE
Fig. 7-S2
- ID
- ZDB-FIG-190807-25
- Publication
- Schulz et al., 2019 - Analysis of the genomic architecture of a complex trait locus in hypertensive rat models links Tmem63c to kidney damage
- Other Figures
- All Figure Page
- Back to All Figure Page
Fig. 7-S2
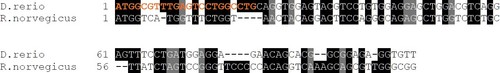
Excerpt from sequence alignment of tmem63c mRNA zebrafish (NM_001159836) vs Tmem63c mRNA rat (NM_001108045.1).Sequence alignment shows the first 100 bp of tmem63c mRNA zebrafish vs. Tmem63c mRNA rat following ATG. Orange bases indicate the zebrafish sequence following ATG targeted by tmem63c ATG-MO to prove no targeting of rat mRNA by the used tmem63c ATG-MO. Sequence identity is 65,82% (Clustal 2.1) for mRNA sequences or 53,52% (Clustal 2.1) for protein sequences, respectively. D., Danio; R., Rattus. |
Expression Data
Expression Detail
Antibody Labeling
Phenotype Data
Phenotype Detail
Acknowledgments
This image is the copyrighted work of the attributed author or publisher, and
ZFIN has permission only to display this image to its users.
Additional permissions should be obtained from the applicable author or publisher of the image.
Full text @ Elife