
Fig. 7-S1
- ID
- ZDB-FIG-190807-24
- Publication
- Schulz et al., 2019 - Analysis of the genomic architecture of a complex trait locus in hypertensive rat models links Tmem63c to kidney damage
- Other Figures
- All Figure Page
- Back to All Figure Page
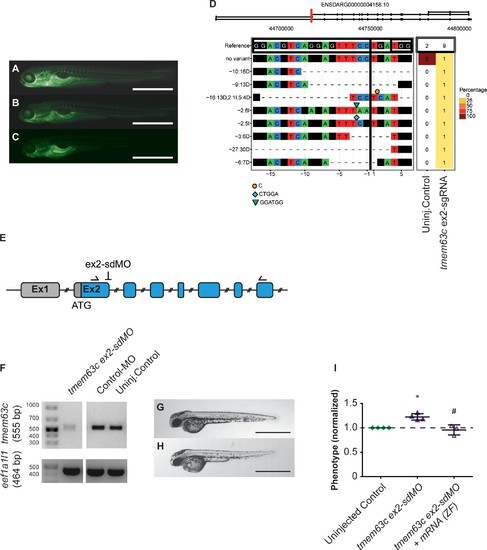
Functional assessment of the glomerular filtration barrier (GFB) in Tg[fabp10a:gc-EGFP] zebrafish embryos.(A–C) Representative fluorescence microscopy pictures of Tg[fabp10a:gc-EGFP] zebrafish embryos categorized as ‘fluorescent’ or ‘deficient-fluorescent’, respectively to assess functionality of the GBM. An embryo of the ‘fluorescent group’ (A) shows clearly visible fluorescence in the trunk vasculature. (B–C) Embryos of different fluorescence intensities both characterized as ‘deficient-fluorescent’ with marked decrease in the fluorescence in the trunk vasculature. (D) Plot of mutagenesis output in transmembrane protein 63 c (tmem63c) crispants as created by CrispR Variants Lite analysis of the sequencing data from individual embryos. The gene schematic at the top illustrates the location of the sgRNA in red with respect to all overlapping transcripts on the reference strand in the Ensembl database (Yates et al., 2016). The panel below shows the pairwise alignment of each variant to the reference genome. The 20 bp sgRNA and the 3 bp PAM sequences are indicated in boxes in the reference sequence, the cutting site is indicated by a vertical line. Deletions are given by “- “and insertions by symbols with the inserted sequences shown underneath the plot with respect to the cutting site. The right panel demonstrates the frequency of the variants in the embryos analyzed with colors corresponding to variant frequencies as shown. The header displays the total number of embryos sequenced. (E–I) Functional assessment of the GFB after tmem63c-knockdown using tmem63c ex2-sdMO. (E) Schematic of tmem63c showing the region in Exon 2 (ex2) targeted by ex2-sdMO. Arrows indicate the positions of primers used for RT-PCR. (F) RT-PCR showing tmem63c-deficiency after injection of tmem63cex2-sdMO, but not in Control-MO injected embryos or uninjected Controls, respectively. Eukaryotic translation elongation factor 1 alpha 1, like 1 (eef1a1l1) is used as a loading control. (F–G) Bright-field view of wildtype embryos at 48 hr post-fertilization (hpf) in uninjected controls (F) and tmem63c ex2-sdMO injected embryos (G). Scale bar = 1 mm. (H) Analysis of gc-EGFP in the trunk vasculature. Shown are embryos categorized as ‘deficient-fluorescent’ (df). Experimental groups are normalized to the corresponding uninjected control group per experiment. Uninjected Control (n = 457); tmem63c ex2-sdMO (n = 297); tmem63c ex2-sdMO + tmem63 c mRNA (ZF) (n = 246); One-way ANOVA with Bonferroni’s multiple comparisons test. Values plottet: mean ±SD, dashed line at y = 1 indicates the uninjected control level; *p=0.0039 vs. uninjected Control, # p=0.0021 vs. tmem63c ex2-sdMO. ZF = zebrafish. Data points in the graph represent the ratio per independent experiment, %(Uninjected Control (df)) / %(experimental group (df)), N ≥ 3. |
| Fish: | |
|---|---|
| Knockdown Reagent: | |
| Observed In: | |
| Stage: | Day 5 |