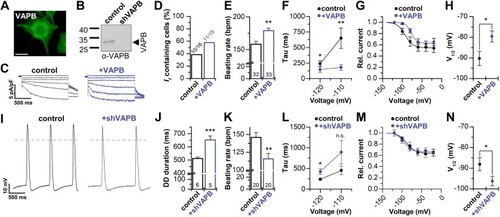
VAPB modulates If of spontaneously beating cardiac HL-1 cells. A) Immunocytochemistry of VAPB in HL-1 cells. Scale bar, 20 µm B) Western blot illustrating the knock-down of VAPB expression in HL-1 cells by shRNA transfection. Control, HL-1 cells transfected with scrambled shRNA. C) Representative If currents of HL-1 cells under control conditions and after VAPB transfection. D) Percentage of HL-1 cells containing If under control conditions (38%) and after VAPB transfection (58%). E) Beating frequency under control conditions (158 ± 4) and after VAPB transfection (179 ± 4), analyzed by optical counting of contractions in original Claycomb medium containing norepinephrine (60). F) Accelerated activation kinetics of VAPB-transfected HL-1 cells (n = 9–10). G) Activation curves of HL-1 cells under control conditions (n = 10) and after VAPB transfection (n = 11). H) Positive shift in the V1/2 of activation of If recorded in VAPB transfected HL-1 cells. Control (scrambled shRNA), −90.3 ± 3.4 mV (n = 10); VAPB transfected, −79.6 ± 2.7 mV (n = 11). I) Representative action potential measurements of wild-type HL-1 and shRNA transfected cells (shVAPB). J) Analysis of the diastolic depolarization (DD duration). K) Beating frequency of HL-1 cells under control conditions and after VAPB knock-down. L) VAPB knock-down slows the activation kinetics (n = 5) of endogenous If currents. M) Transfection of shRNA (n = 5) shifts the voltage-dependence of activation (V1/2) of If to more negative potentials (n = 6). N) V1/2 values for control (scrambled shRNA) were −88.2 ± 3.1 mV (n = 6) and for shRNA-transfection (shVAPB), −96.2 ± 2.3 mV (n = 5), respectively. (I, J), Scrambled shRNA was used as control. All data are presented as means ± sem. The number of experiments (n) is indicated in the bar graphs. N.s., not significant. *P < 0.05, **P < 0.01, ***P < 0.001 [unpaired Student’s t test (D, G, H, M) or Mann-Whitney U test (E, F, J–L, N)
|
